Message Boards Message Boards

0
|
2065 Views
|
2 Replies
|
0 Total Likes
View groups...
Share
Share this post:

Add text content to a Legend?

Posted 7 years ago

Hi, I tried to add a Legend to my figure. But I want the legend to show some text content, like low, medium, high, instead of values. The code I'm trying to use is

BarLegend["Rainbow", {"low", "high"}]

It gives me nothing. Can anyone help me with this? Which function I would try? Thank you.

POSTED BY: Baos Bai
2 Replies

Unfortunately that does not work, but you could create your own quite easily:

bar = DensityPlot[y,{x,0,1},{y,0,1},
   AspectRatio->12,
   PlotRangePadding->None,
   FrameTicks->{{None,{{0,"Low"},{1/2,"Medium"},{1,"High"}}},{None,None}},
   ColorFunction->"Rainbow",
   ImageSize->{Automatic,200},
   FrameTicksStyle->Directive[Black,12]
];
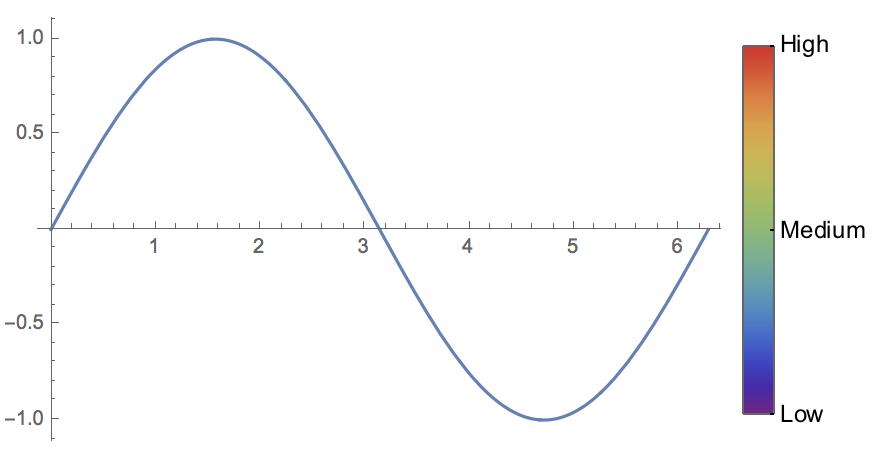
Plot[Sin[x],{x,0,2Pi},PlotLegends->bar]

giving:

enter image description here

POSTED BY: Sander Huisman
Posted 7 years ago

Hi Sander, It works. I appreciate it. Thank you for you help.

POSTED BY: Baos Bai
Reply to this discussion
Community posts can be styled and formatted using the Markdown syntax.
Reply Preview
Attachments
Remove
or Discard

Group Abstract Group Abstract