Message Boards Message Boards

0
|
5512 Views
|
6 Replies
|
6 Total Likes
View groups...
Share
Share this post:

Avoid different stats and ranking while using FindDistribution?

Hi, I am trying to get the 5 top distributions of some experimental data but every time i run the function FindDistribution i get different statistics and ranking. Am I doing something wrong or is this a bug ?

Please kindly advise. Many thanks.

Attachments:
POSTED BY: Amin C
6 Replies

Thank you so much!

POSTED BY: Amin C

Hi Amin,

I believe that the problem is where you position the PlotLegends. It would need to go into the Plot function. This can be achieved like so:

Show[Histogram[cana, Automatic, "PDF"], 
 Plot[Evaluate[
PDF[#, x] & /@ Evaluate[Normal[(Normal@FindDistribution[cana, 5, All, TargetFunctions -> "Continuous"])][[All, 1]]]], {x, 0, 1200}, PlotLegends -> Automatic]]

enter image description here

But as you can see the labels are just from 1 to 5. This might be better for you:

dists = Evaluate[Normal[(Normal@FindDistribution[cana, 5, All, TargetFunctions -> "Continuous"])][[All, 1]]]; Show[
Histogram[cana, Automatic, "PDF"], Plot[Evaluate[PDF[#, x] & /@ dists], {x, 0, 1200}, 
PlotLegends -> Evaluate[StringReplace[#, "Distribution" -> " Distribution"] & /@ ToString /@ (Head /@ dists)]]]

enter image description here

Here I first generate the estimates for the distributions. When I plot it, I use these distributions twice: first for the actual plotting and second for the labelling. The funny code in the Labelling bit is only to get a space before "Distribution".

If you require the entire distributions (not just the head label) then it is one (or two depending on how you count) function shorter:

dists = Evaluate[Normal[(Normal@FindDistribution[cana, 5, All, TargetFunctions -> "Continuous"])][[All, 1]]]; 
Show[Histogram[cana, Automatic, "PDF"], Plot[Evaluate[PDF[#, x] & /@ dists], {x, 0, 1200}, 
PlotLegends -> Evaluate[StringReplace[#, "Distribution" -> " Distribution"] & /@ ToString /@ dists]]]

enter image description here

Best wishes,

Marco

POSTED BY: Marco Thiel

Hello Marc, Do you mind please indicating where I should inject PlotLegends to get the distribution name of each curves . Something like this:

Show[Histogram[cana, Automatic, "PDF"], 
 Plot[{PDF[WeibullDistribution[3.53307, 554.326], x], 
   PDF[LogNormalDistribution[6.16868, 0.321502], x], 
   PDF[LogisticDistribution[494.99, 81.1476], x]}, {x, 0, 1200}, 
  PlotRange -> All, 
  PlotLegends -> {WeibullDistribution, LogNormalDistribution, 
    LogisticDistribution}], ImageSize -> Large]

I tried

Show[Histogram[cana, Automatic, "PDF"], 
Plot[PDF[#, x], {x, 0, 1200}] & /@ Evaluate[Normal[(Normal@FindDistribution[cana, 5, All, TargetFunctions -> "Continuous"])][[All, 1]]],PlotLegends->Automatic]

and

Show[Histogram[cana, Automatic, "PDF"], 
Plot[PDF[#, x], {x, 0, 1200}] & /@ 
Flatten[Table[Select[Normal[Normal[FindDistribution[cana, 5, All, 
TargetFunctions -> "Continuous"][[All, 1]]]][[All, 1]], Head[#] == GammaDistribution &], {5}]],PlotLegends->Automatic]

but it did not give me any output .

Thank you.

POSTED BY: Amin C

Dear Marco, Thank you so much for your help and elegantly instructive response. I will be more careful using the word " bug" .Should I edit the title ? Cheers, Amin.

POSTED BY: Amin C

'non-deterministic behavior' rather than bug

POSTED BY: Sander Huisman

Hi Amin,

I don't think that that is a bug. FindDistribution involves a stochastic process. If you fix the random seed the results will be exactly identical.

FindDistribution[cana, 5, All, TargetFunctions -> "Continuous", "RandomSeed" -> 23544325]

In other words,

FindDistribution[cana, 5, All, TargetFunctions -> "Continuous"]

changes every time you execute it, whereas

FindDistribution[cana, 5, All, TargetFunctions -> "Continuous", "RandomSeed" -> 23544325]

Does not.

BTW, you can also look at the difference of the estimated distributions without fixing the random seed. Here are all 5 estimates:

Show[Histogram[cana, Automatic, "PDF"], 
Plot[PDF[#, x], {x, 0, 1200}] & /@ Evaluate[Normal[(Normal@FindDistribution[cana, 5, All, TargetFunctions -> "Continuous"])][[All, 1]]]]
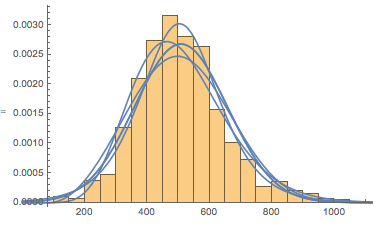
enter image description here

If you look for the different estimates of, say, the GammaDistribution if you run the thing several times it looks like this:

Show[Histogram[cana, Automatic, "PDF"], 
Plot[PDF[#, x], {x, 0, 1200}] & /@ 
Flatten[Table[Select[Normal[Normal[FindDistribution[cana, 5, All, 
TargetFunctions -> "Continuous"][[All, 1]]]][[All, 1]], Head[#] == GammaDistribution &], {5}]]]
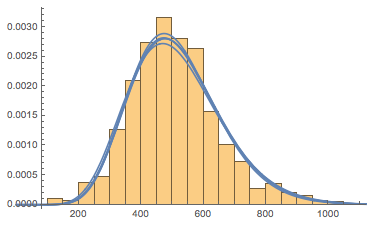
enter image description here

I would assume that the variation between the estimates becomes smaller if you have more points in your dataset.

Cheers,

Marco

PS: I think one should only use the word "bug" in the title if it is confirmed.

POSTED BY: Marco Thiel
Reply to this discussion
Community posts can be styled and formatted using the Markdown syntax.
Reply Preview
Attachments
Remove
or Discard

Group Abstract Group Abstract