Message Boards Message Boards

17
|
34810 Views
|
8 Replies
|
30 Total Likes
View groups...
Share
Share this post:

Ulam spiral to appear on Sept. 2013 cover of Math Horizons

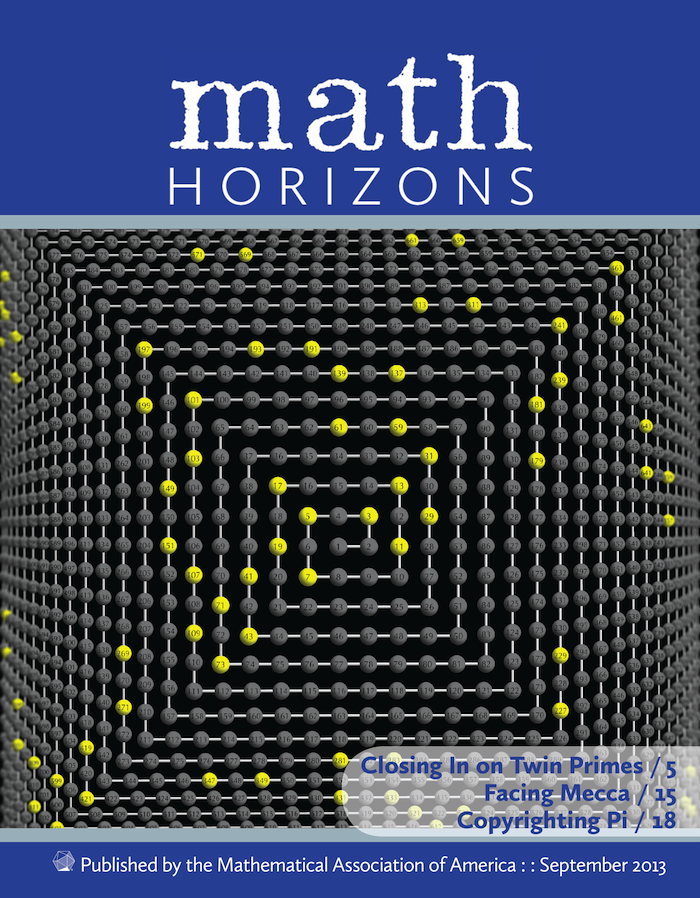
The cover image will show an Ulam spiral with the twin primes highlighted. It's actually a Graphics3D -- a pyramid viewed from above. The code is below for those who wish to play with it. NOTE: This appeared at the end of another discussion "Text in front of objects in Graphics3D" on Graphics and Visualization. I wanted to share the final result more broadly.


 Clear[s, e, n, w, dir, tab, m, \[Delta], positions, allPrimes,
   twinPrimes, sph, ulam];
 m = 20; (* m is the no. of spiral "laps", so (2m)^2 numbers will be \
 displayed *)
 \[Delta] = .1; (* \[Delta] = vertical depth added to \
 pyramid for each number *)
 
 dir = {s, e, n, w}; (* directions: south, east, north, west *)
 
tab = {};
Do[dir = RotateLeft[dir]; AppendTo[tab, Table[First[dir], {k}]];
  dir = RotateLeft[dir];
  AppendTo[tab, Table[First[dir], {k}]], {k, 1, 2 m}];
positions =
  FoldList[Plus, {0, 0, 0},
   Take[Flatten[tab], 4 m^2 - 1] /. {e -> {\[Delta], -1, 0},
     n -> {\[Delta], 0, 1}, w -> {\[Delta], 1, 0},
     s -> {\[Delta], 0, -1}}];
allPrimes = PrimeQ[Range[4 m^2]];
twinPrimes =
  MapThread[
   Or, {MapThread[
     And, {allPrimes, Join[{False, False}, Drop[allPrimes, -2]]}],
    MapThread[
     And, {allPrimes, Join[Drop[allPrimes, 2], {False, False}]}]}];
sph[k_, pos_, highlight_] :=
  Translate[
   SphericalPlot3D[.3, {\[Theta], 0, Pi}, {\[Phi], 0, 2 Pi},
     Mesh -> None,
     PlotStyle ->
      Texture[Graphics[
        Style[Text[k, {0, 0}, {0, 0}, {0, 1}], 128,
         FontFamily -> "Optima"], AspectRatio -> 2,
        Background ->
         If[highlight, RGBColor[1.`, 1.`, 0.`],
          RGBColor[.5`, .5`, .5`]], ImageSize -> 400]],
     TextureCoordinateFunction -> ({#4, #5} &)][[1]], pos];
ulam = Graphics3D[{
    {Gray, Tube[positions, .05]},
    MapThread[sph, {Range[4 m^2], positions, twinPrimes}]
    }, ViewPoint -> {-1.8, 0, 0}, PlotRangePadding -> None,
   Boxed -> False, Lighting -> "Neutral", ImageSize -> 5200,
   Background -> Black];

POSTED BY: Bruce Torrence
8 Replies
Jira - that is some very nice image. How did you happen to come upon this? I love high-res in Mathematica so much, I did an animation to scan through it:

POSTED BY: Vitaliy Kaurov
Posted 11 years ago
@Vitaliy: I think I was playing with stuff, such as Ulam's spiral and Archimedean spiral, which are known to exhibit patterns with primes, which is of course easy to visualize. Then I was just checking how Fermat's spiral - along with sunflower-like discrete arrangements - would plot. From there on, it was mostly polishing...

The nice thing about Mathematica is that this kind of recreational math is often quite easy to try out, on just a vague hunch of interesting directions.
POSTED BY: Jari Kirma
Craig - nice idea, these are my reflections of it with some modifications and Jari's advise. Besides some tricks with scaling to make less frequent numbers more prominent, I think most important is to keep Background to be black when using opacity. White shines through translucent objects and makes them duller.
 r = 4/(3 GoldenRatio);
 radii = N@Table[r/Max[1, PrimeOmega[n]], {n, 100000}];
 {minrad, maxrad} = Through[{Min, Max}[radii]];
 
 
 Graphics[ParallelTable[{Opacity[.7], {ColorData["BrightBands"][
      Sin[N[(radii[[n]] - minrad)/(maxrad - minrad)] Pi/2]^.4],
     Disk[RotationTransform[N@Pi (3 - Sqrt[5]) n][{Sqrt[n], 0}],
      2 (1 - Sin[radii[[n]] Pi/2]^.4)]}}, {n, 15000}],
ImageSize -> 1000, Background -> Black]

POSTED BY: Vitaliy Kaurov
Hello,
This is such a lovely image, that I decided to play with colors and opacity with it.
Here is the image (I converted to numeric to speed up the computation a little)
 r = 4/(3 GoldenRatio);
 radii = N@Table[r/Max[1, PrimeOmega[n]], {n, 100000}];
 {minrad, maxrad} = Through[{Min, Max}[radii]];
 
 Graphics[Table[
   {Opacity[0.25],
    {
     ColorData[
       "DarkRainbow"][(radii[[n]] - minrad)/(maxrad - minrad)],
    Disk[RotationTransform[N@Pi (3 - Sqrt[5]) n][{Sqrt[n], 0}],
     4 radii[[n]]]
    }
   }
  , {n, 100000}]]


One thing that stuck me here is that the render is fairly slow (even if Opacity is not used).
For Graphics3D, Sphere can take a list of centers: Sphere[{{x1,y1,z1},....., {xn,yn,zn}},r] which  (J. Fultz tells me) speeds up rendering for large n.  Disk doesn't have such an option...
POSTED BY: W. Craig Carter
Posted 11 years ago
Another reason for slowness might be that coordinates are actually precise, instead of machine-precision reals. That's not really necessary for graphics like this...
POSTED BY: Jari Kirma
Posted 11 years ago
Primes, and compositeness of integers can create interesting patterns on spirals. In the one below, series of highly composite numbers show as dark streaks of varying locations and curvatures. Figuring out what these arcs correspond to can be quite an intellectual challenge. More you look at it (preferably at original resolution), more you can find these patterns.
With[{size = {1920, 1200}, numbers = 100000, r = 4/(3 GoldenRatio)},
Graphics[{White,
   Table[Disk[RotationTransform[Pi (3 - Sqrt[5]) n][{Sqrt[n], 0}],
     r/Max[1, PrimeOmega[n]]], {n, numbers}]},
  PlotRange -> (r/3) (# {-1, 1}/2 & /@ size), ImagePadding -> None,
  ImageSize -> size, Background -> Black]]
POSTED BY: Jari Kirma
I just realized that the September issue of Math Horizons is live and the cover looks beautiful - congratulations, Bruce!

POSTED BY: Vitaliy Kaurov
This looks great! We'd be interested in sharing this on our social media and elsewhere--when the journal goes out, could you send us an email?
POSTED BY: Brice Russ
Reply to this discussion
Community posts can be styled and formatted using the Markdown syntax.
Reply Preview
Attachments
Remove
or Discard

Group Abstract Group Abstract