Last summer, I attended Wolfram Summer Camp at Bentley University to develop my analytical and coding skills. I enjoyed coding with Mathematica, therefore I started to participate in mentorship program with help from my mentor Alison Kimball. "Graphics," one of the most useful functions in Mathematica, was used it mainly in my project. It helps generate beautiful and various images. "Data" statistically means that a set of number of a collection that needed to be organized, analyzed, and interpreted. Thus, infographic becomes a tool to help people understand a large data set well, and visually presents information quickly and clearly.
Population
I started my project by making infographics for CountryData[] this function. CountryData has so many different tags, and it contains a lot of information for any specific countries. I used "population" to start my project. An infographic for population will clearly show both male population and female population. Male and Female are distinguished by mouths. The following graphic is an example of United States' population: 
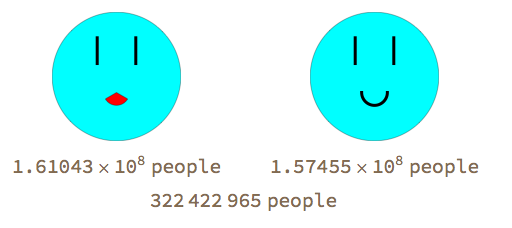
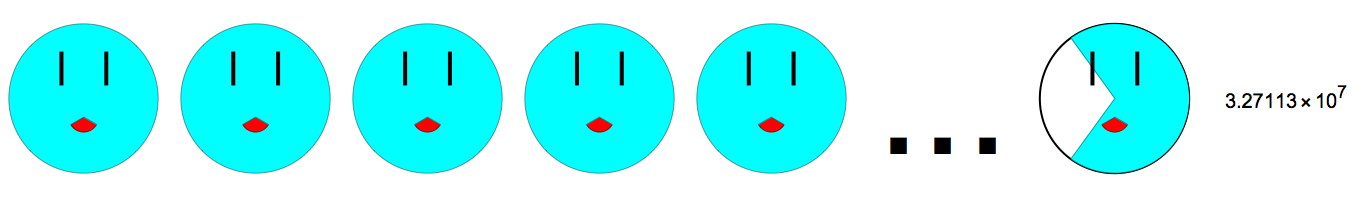
Of course, either male population and female population can also be shown with infographics. The population of male or female is represented by the number of faces. The last face will show the fraction of the rest of the population. The number of the population will be shown at the end. The following example shows the female population of France:

Area
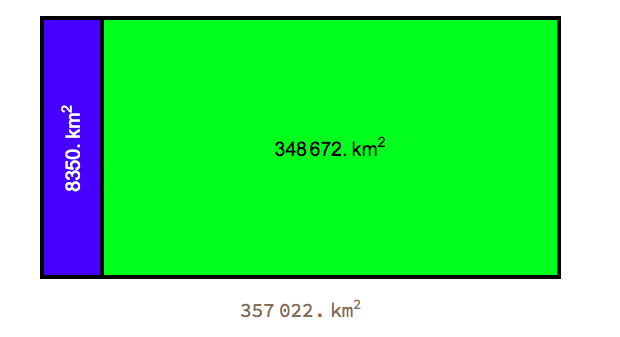
After population, I started to play around with another basic concept, area. Area will show two parts: land area and water area. Land area and water area are distinguished by color. The following two example is area of Germany:

Time and Temperature
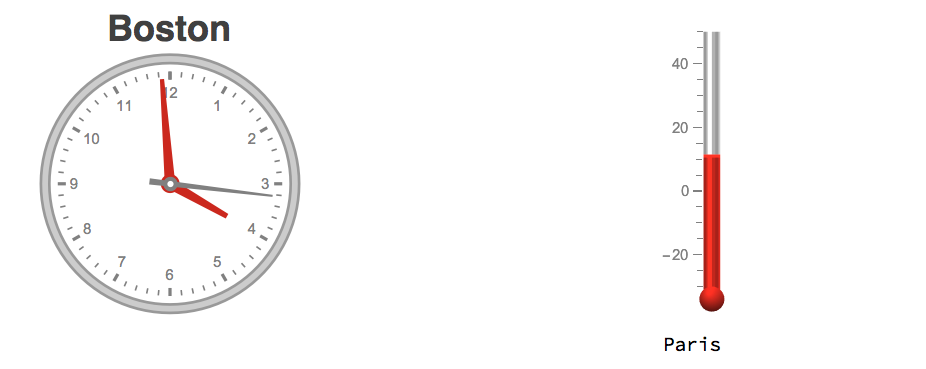
Time and temperature are different from previous arguments. They change based on regions. Thus, I used CityData[] instead of CountryData[] to prevent "generalizing" a country's time or temperature. The following examples are the time of Boston and the temperature of Paris: 

Population Density
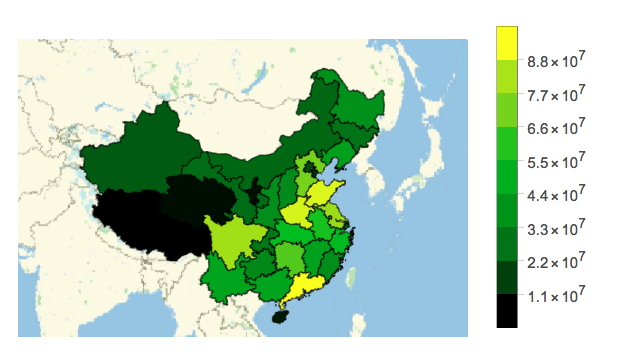
In improving the population argument, I made infographics for another tag, population density. Population density shows how crowded or deserted every region is in a country. It gives people a sense that which region would be crowded for traveling :) The following example is the population density of China:

Ocean Position
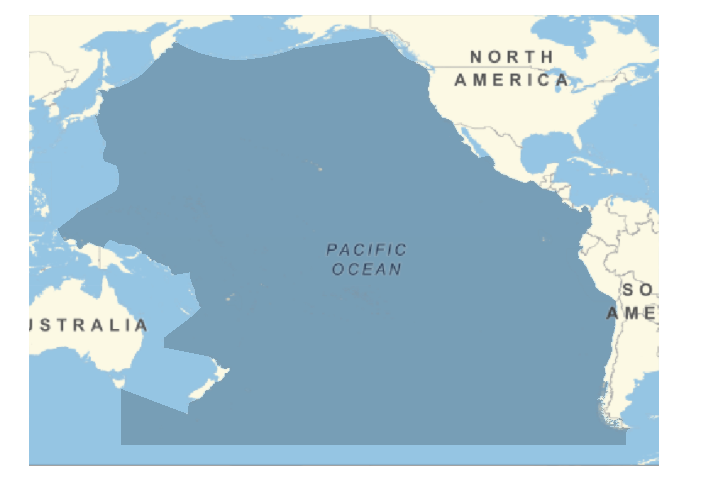
The infographic for ocean position is to help locate one specific ocean by using its coordinates. At first after I finished coding infographics for this argument, I found that the name of Atlantic Ocean didn't work for it, same as Pacific Ocean. With discussion with Alison Kimball, I realized those oceans are too big to locate their coordinates, but without putting names on, they already have names on the map. Therefore, I used alternative method which was to only put names of those "normal" oceans whose coordinates are applicable while those gigantic oceans already have their names. The following example is the infographic of Pacific Ocean:

Overall
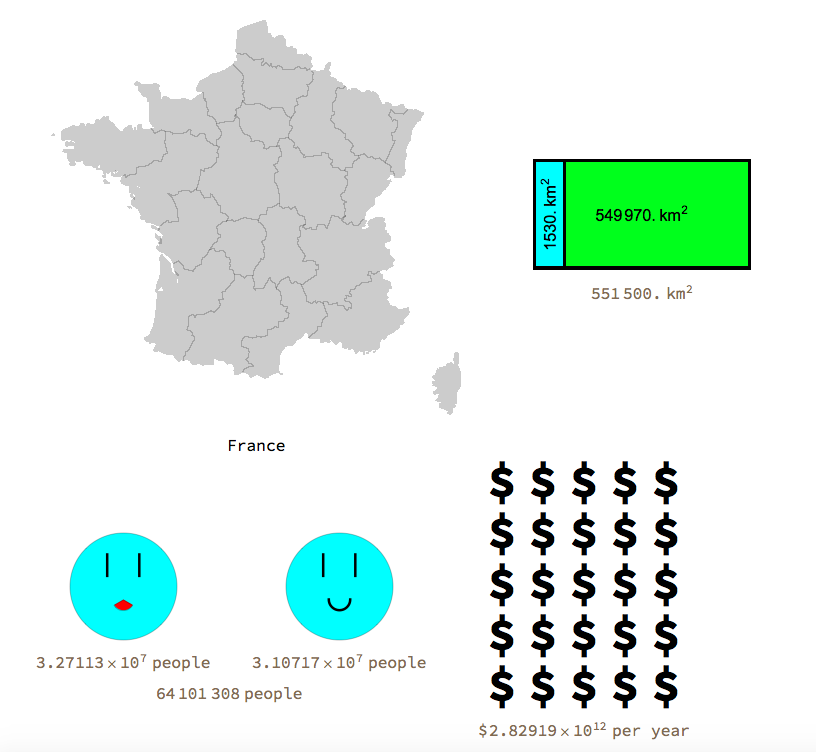
The previous examples all depend on the second argument. I created another type of infographic that shows basic knowledge of one country which are shape, area, population, and GDP. This is different from the previous one because it only relies on one argument: the name of the country. The function "GDP" in Mathematica is in dollar, so the graphics for GDP is represented by using dollar signs even though each country has its own currency. The following example is the overall view of France:

Conclusion
Even though I faced a lot of challenges when I worked on my project, I learned a lot from this experience. Working with mentor from Wolfram, I know deeper of Mathematica. This project taught me extensive knowledge of this language. I will be so happy if I can have chance to do another project.


