Message Boards Message Boards

0
|
4681 Views
|
3 Replies
|
0 Total Likes
View groups...
Share
Share this post:

Create a surface map?

Posted 7 years ago

Hello all,

I'm brand new to Mathematica, (though I used at the Uni 20+ years ago!) and I need to accomplished a relatively simple task before deciding for a paid subscription. I have experience with Visual Basic (excel), and R, so I'm not totally lost (I Hope!)

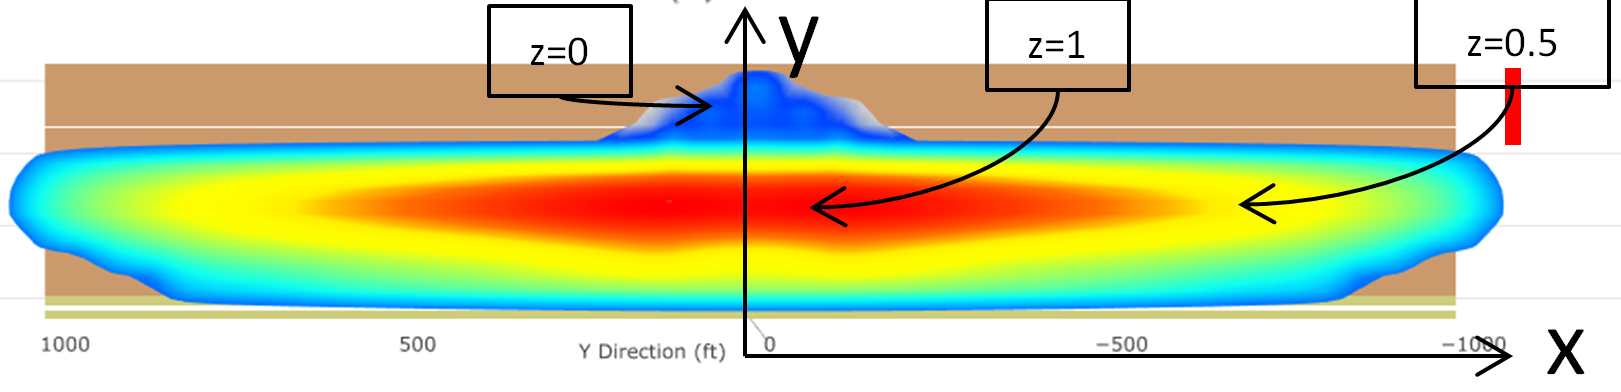
I need to generate a scatter plot with x, y, z, data, where x & y are numeric coordinates in feet. and z is the value of a property, for instance, thickness. I need to generate a colored surface map of the property.

I'm evaluating an existing platform (the image below was generated by it), but I believe Mathematica will be by far more customizable, fast and reliable.

Attached is an example of what I want to achieve

Frac width

I was able to load the file using the following code:

s = Import["C:\\Users\\pepe.pepe\\Desktop\\Frac1.xlsx"]

and I was experimenting with the ContourPlot command, but all the examples I find show its use when evaluating a formula, none of them shows what to do when you have your data in and x, y, z format.

Thanks in advance, apologies if something similar was already posted, I couldn't find anything similar.

Rgds,

Jose

Attachments:
POSTED BY: Jose Diaz
3 Replies

Your data has four rows East (-519 to 519) North (760 to 762) Depth (2485 to 2541) and FracWith (0.0004 to 0.0037) Perhaps you can explain how your data fits the picture you posted? You should indeed use ListContourPlot.

POSTED BY: l van Veen

Hi Jose,

yes, as Sander pointed out, try Listsomething. But furthermore your data seem to have a problem - or at least I do not understand what they are supposed to represent, because many (or all?) coordinates (x,y) appear many times with different z values:

ClearAll["Global`*"]
data0 = First@Import["<some path>/Frac1.xlsx"];
expanation = First[data0];
data = Rest[data0];
dataXY = data[[All, 1 ;; 2]];
Short[Tally[dataXY], 3]

(* Out:   \
{{{512.06039832316`,760.172554394678`},33},{{507.488413104153`,760.\
184180106843`},39},\[LeftSkeleton]701\[RightSkeleton],{{-510.\
540935092459`,760.176417232832`},2},{{-519.449122143492`,760.\
159546011715`},2}}  *)

Regards -- Henrik

POSTED BY: Henrik Schachner

Try using the brother of ContourPlot: ListContourPlot

POSTED BY: Sander Huisman
Reply to this discussion
Community posts can be styled and formatted using the Markdown syntax.
Reply Preview
Attachments
Remove
or Discard

Group Abstract Group Abstract