Here is a code example
spherePlot = Graphics3D[{
  RGBColor[0, 0.74, 0.91], Opacity[0.7], Sphere[{0, 0, 0}, 0.998]
}];

labelPlot = Graphics3D[
  Style[{
    Text["A", {Cos[60 \[Degree]], 0, Sin[60 \[Degree]]}],
    Text["B", {Cos[45 \[Degree]], Sin[-45 \[Degree]], 0}]
    }, "Panel", 20, Background -> None
  ]
];

Show[
  spherePlot,
  labelPlot,
  Boxed -> False
]
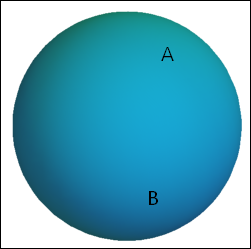
Comparision (dont have 11.0.1 installed anymore):
In[4]:= $Version
Out[4]= "10.4.1 for Microsoft Windows (64-bit) (April 11, 2016)"
In[1]:= $Version
Out[1]= "11.1.0 for Microsoft Windows (64-bit) (March 13, 2017)"
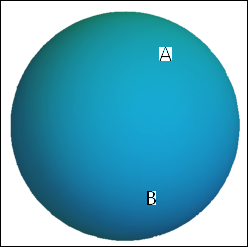
Edit: If the Opacity directive is removed, or set to 1, the labels renders as expected


