Hi Andreas,
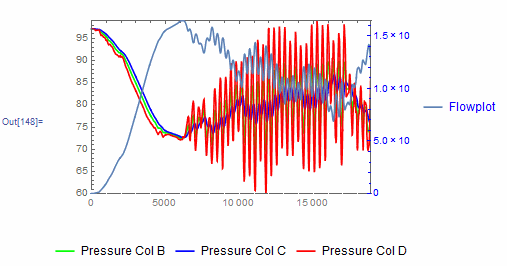
I assume this what you expected !
ClearAll["Global`"]

calcresults =
  Import["D:\\En\\Mathematica_Stuff\\CALCRESULTS.xlsx", {"Data", 1}];
p1                       = calcresults[[All, {1 , 2}]];
p2                       = calcresults[[All, {1 , 3}]];
p3                       = calcresults[[All, {1 , 4}]];
flowresults  = calcresults[[All,  {1 , 5} ]];

pressureplot = ListLinePlot[{p1, p2, p3}
  , PlotStyle -> {Green , Blue , Red}
  , Frame -> {{True, None}, {True, True}}
  , FrameStyle -> Automatic
  , FrameTicksStyle -> {{None,
     Red}, {Directive[FontColor -> Gray, White], None}}
  , PlotLegends ->
   Placed[{"Pressure Col B", "Pressure Col C", "Pressure Col D"},
    Bottom]
  , PlotRangePadding -> 0
  , ImagePadding -> 40
  ]
flowplot = ListLinePlot[
  flowresults
  , Frame -> {{None, True}, {None, None}}
  , FrameTicks -> All
  , FrameStyle -> Automatic
  , FrameTicksStyle -> {{None,
     Blue}, {Directive[FontColor -> Gray, White], None}}
  , PlotRangePadding -> 0
  , ImagePadding -> 40
  , PlotLegends -> {Style["Flowplot", Blue]}
  ]
Overlay[{pressureplot, flowplot}]

I hope this will help, see file attached !
Regards....Jos
 Attachments: