Message Boards Message Boards

2
|
12740 Views
|
9 Replies
|
7 Total Likes
View groups...
Share
Share this post:

[?] Plot a left and a right axis with ListPlot?

Dear Community,

Probably a very newbie question: how can I have a left (primary) , and a right (secondary) vertical axis simultaneously in a ListPlot chart? I would need it because the two series to be plotted have very different magnitudes.

Tx in advance Andras

POSTED BY: Andras Gilicz
9 Replies

Hi Andreas,

Play around with the function "ImageSize" in the indivudual plots.

Example: ImageSize->600 or ImageSize->1.1{500,350}

File updated with the a/m function !

Good luck,.......Jos

Attachments:
POSTED BY: Jos Klaps

Dear Jos,

Perfect solution, thank you very much. Very kind of you :-)

best regards

Andras

POSTED BY: Andras Gilicz

Dear Jos,

May I ask for a little more help? I tried to resize the combined Overlay plot by dragging its corner by the mouse, but it is not possible. No problem with the individual plots pressureplot and flowplot. Do you possibly have some idea how it could be done?

Tx in advance, best regards Andras

POSTED BY: Andras Gilicz

Hi Andreas,

I assume this what you expected !

ClearAll["Global`"]

calcresults = 
  Import["D:\\En\\Mathematica_Stuff\\CALCRESULTS.xlsx", {"Data", 1}];
p1                       = calcresults[[All, {1 , 2}]];
p2                       = calcresults[[All, {1 , 3}]];
p3                       = calcresults[[All, {1 , 4}]];
flowresults  = calcresults[[All,  {1 , 5} ]]; 

pressureplot = ListLinePlot[{p1, p2, p3} 
  , PlotStyle -> {Green , Blue , Red} 
  , Frame -> {{True, None}, {True, True}}
  , FrameStyle -> Automatic
  , FrameTicksStyle -> {{None, 
     Red}, {Directive[FontColor -> Gray, White], None}}
  , PlotLegends -> 
   Placed[{"Pressure Col B", "Pressure Col C", "Pressure Col D"}, 
    Bottom]
  , PlotRangePadding -> 0
  , ImagePadding -> 40
  ]
flowplot = ListLinePlot[ 
  flowresults 
  , Frame -> {{None, True}, {None, None}}
  , FrameTicks -> All
  , FrameStyle -> Automatic
  , FrameTicksStyle -> {{None, 
     Blue}, {Directive[FontColor -> Gray, White], None}}
  , PlotRangePadding -> 0
  , ImagePadding -> 40
  , PlotLegends -> {Style["Flowplot", Blue]}
  ]
Overlay[{pressureplot, flowplot}]
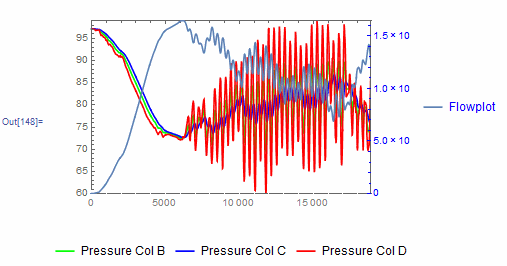
enter image description here

I hope this will help, see file attached !

Regards....Jos

Attachments:
POSTED BY: Jos Klaps

@Jos Klaps : Nice trick to do it using Overlay - of course! There is a more "official solution" (https : // reference.wolfram.com/language/howto/ GeneratePlotsWithTwoVerticalScales.html) which is much more complicated.

Regards -- Henrik

POSTED BY: Henrik Schachner

@Hendrik, I know this code but is much more complicated as you aleready mentioned. The function "Overlay" is simple to use. Thanks anyway for the tip and reply !

Regards,....Jos

POSTED BY: Jos Klaps

Dear Jos,

Wow, yes, this is exactly what I meant. Thank you very much :-) Overlay is the command, which I was not aware of. best regards Andras

POSTED BY: Andras Gilicz

Dear Jos,

I've summarized the results of a lengthy engineering calculation in a spreadsheet, CALCRESULTS.xlsx. I try to plot results with the attached notebook ListLinePlot.nb. I would like to combine pressureplot and flowresults within one chart, where pressures belong to the left axis, and flowresults belong to the right axis, because they are very different in magnitude. Timepoints are the same.

Tx in advance, Andras

Attachments:
POSTED BY: Andras Gilicz

Andreas,

What is your code so far ?

POSTED BY: Jos Klaps
Reply to this discussion
Community posts can be styled and formatted using the Markdown syntax.
Reply Preview
Attachments
Remove
or Discard

Group Abstract Group Abstract