Message Boards Message Boards

0
|
7067 Views
|
5 Replies
|
0 Total Likes
View groups...
Share
Share this post:

[?] Plot 3D a matrix using ListPlot3D or Histogram3D?

Posted 7 years ago

I have the matrix

a={
{0.709,0.748,0.761,0.770,0.775,0.780,0.783,0.786,0.788,0.790,0.791},
{0.622,0.789,0.803,0.813,0.818,0.823,0.826,0.829,0.831,0.834,0.835},
{0.762,0.803,0.818,0.827,0.833,0.838,0.841,0.844,0.846,0.849,0.850},
{0.770,0.812,0.827,0.837,0.842,0.847,0.850,0.854,0.856,0.858,0.860},
{0.776,0.818,0.833,0.842,0.848,0.853,0.856,0.859,0.861,0.864,0.865},
{0.780,0.822,0.837,0.846,0.852,0.858,0.861,0.865,0.867,0.869,0.870},
{0.783,0.826,0.841,0.850,0.856,0.860,0.864,0.868,0.870,0.872,0.874},
{0.786,0.828,0.844,0.853,0.859,0.863,0.867,0.871,0.873,0.876,0.877},
{0.788,0.831,0.846,0.855,0.861,0.866,0.869,0.872,0.875,0.876,0.879},
{0.790,0.833,0.848,0.857,0.863,0.868,0.872,0.875,0.877,0.881,0.882},
{0.792,0.834,0.850,0.859,0.865,0.870,0.873,0.876,0.879,0.881,0.883}}

how to plot this matrix in 3D i and j varie to 0 and 10 i tried

ListPlot3D[a, DataRange -> {{0, 10}, {0, 10}}]           

and I found
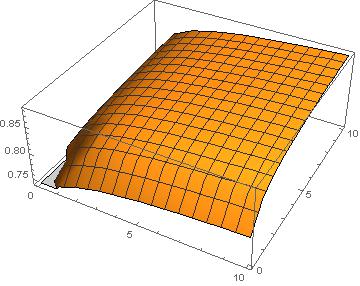
enter image description here

How little I trace in Histogram3D ?

POSTED BY: n n
5 Replies

Maybe you can add labels and change the point of view to highlight the fact that the value of the matrix increases with i and j:

ListPlot3D[a, DataRange -> {{0, 10}, {0, 10}}, 
 InterpolationOrder -> 0, Filling -> Bottom, 
 AxesLabel -> {i, j, None}, ViewPoint -> {-1.5, -2, 2}]

By the way, there may be an error in the first value in the second column.

POSTED BY: Gianluca Gorni

@n n Your posts come out empty because you do not edit properly your code. Do you see the difference in how Gianluca Gorni code looks - framed and colored? Please EDIT your posts to improve formatting, do NOT make duplicate posts. Edit them according this tutorial: https://wolfr.am/READ-1ST This is how yor code should look - framed and colored:

ListPlot3D[a, DataRange -> {{0, 10}, {0, 10}}, 
InterpolationOrder -> 0, Filling -> Bottom]
POSTED BY: Moderation Team
Posted 7 years ago

With your code I got this graph, but the matrix it is values of energy that increases as i and j increases then what is the proper graph for shows the increase in energy values with the increase of i And j

ListPlot3D[a, DataRange -> {{0, 10}, {0, 10}},InterpolationOrder -> 0, Filling -> Bottom]                                                                                                                             

enter image description here

POSTED BY: n n

@n n this is not the first request for you: please make sure you know the rules and how to format your code properly, which you can find here: https://wolfr.am/READ-1ST If you do not format code, it may become corrupted and useless to other members. Please respect the rules. Also make breaks in your paragraphs and images to make your posts more readable. Please do not ignore moderators suggestions.

enter image description here

POSTED BY: Moderation Team

Perhaps you want something like this:

ListPlot3D[a, DataRange -> {{0, 10}, {0, 10}}, 
 InterpolationOrder -> 0, Filling -> Bottom]
POSTED BY: Gianluca Gorni
Reply to this discussion
Community posts can be styled and formatted using the Markdown syntax.
Reply Preview
Attachments
Remove
or Discard

Group Abstract Group Abstract