Here the solution:
Grid[
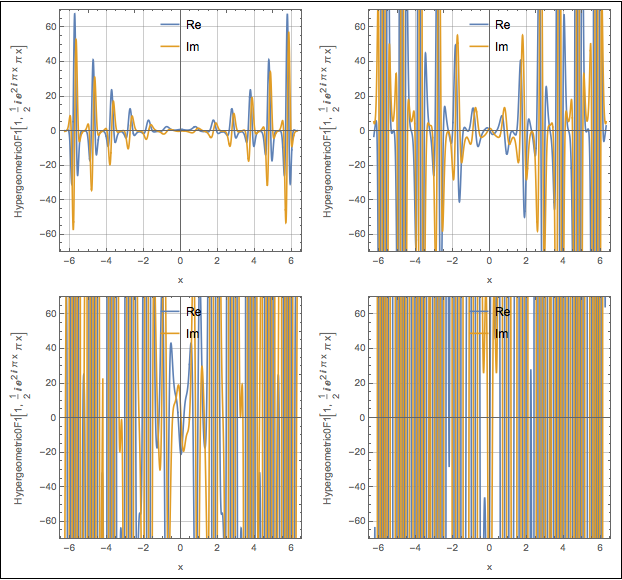
Partition[Table[
Plot[
Evaluate[{
Re[D[Hypergeometric0F1[1,(I*Pi*x/2)*Exp[I* 2\[Pi] x]],{x,i}]],
Im[D[Hypergeometric0F1[1,(I*Pi*x/2)*Exp[I* 2\[Pi] x]],{x,i}]]}],
{x,-2\[Pi],2\[Pi]},
PlotRange->{-70,70},
Frame->True,
GridLines->Automatic,
AspectRatio->1,
FrameLabel->{"x",StringForm["Text[Hypergeometric0F1[1, ((Complex[0, Rational[1, 2]] E^((Complex[0, 2] Pi) x)) Pi) x]]",i]},
PlotLegends->Placed[{"Re","Im"},{Center,Top}],
ImageSize->300],
{i,0,3}],2],Frame->True]
 Attachments:


