If you (like me) are both a data geek and a Fred-Rogers-raised child of the 70's, you probably caught Owen Phillips's nice piece of cardigan-centric data science yesterday Every Color Of Cardigan Mister Rogers Wore From 19792001. He posted his R code for scraping and visualizing the data on GitHub, but I wanted to see if I could improve slightly on that dataset and post something that other Wolfram Language users could tinker with. With a little bit of experimentation, I found that I could generate a nice little dataset with two lines of code. First, a function that takes an episode number, finds the original air date (on Tim Lybarger's excellent neighborhoodarchive.com), and turns it into a DateObject:
epDate[ep_] :=
 Cases[Import[
    "http://www.neighborhoodarchive.com/mrn/episodes/" <> ep <>
     "/index.html", "FullData"], {"Air Date", date_} :>
    DateObject[date], Infinity][[1]]
And second, some code that scrapes episode numbers and approximate sweater colors out of a neighborhoodarchive.com blog post (archived by the Internet Archive), then uses the previous function to get an air date for each episode (and sweater):
sweats = Dataset[<|"EpisodeNumber" -> First@#,
      "Date" -> epDate@First@#,
      "SweaterColor" -> Last@#|> & /@ (Cases[
       Import["https://web.archive.org/web/20110525014454/http:\
//neighborhoodarchive.blogspot.com/2011/05/sweater-colors.html",
        "XMLObject"],
       XMLElement[
         "td", {"colspan" -> "1", "rowspan" -> "1",
          "bgcolor" -> col__}, {XMLElement[
           "div", {"align" -> "center",
            "class" -> "style8"}, {ep___}]}] :>
        Rule[ep, RGBColor@col], Infinity] //.
      XMLElement[_, _, {episode_}] :> episode)];
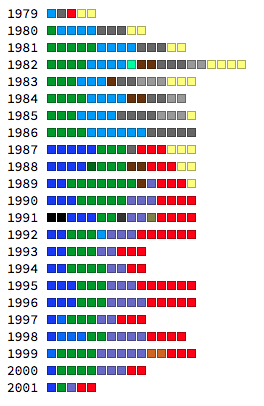
To save others the trouble of scraping and regenerating all this data, I went an extra step and submitted a new ResourceObject to the Wolfram Data Repository (Mister Rogers' Sweater Colors), so you can immediately grab it and start producing interesting visualizations and analyses...
Grid[With[{data =
    Row[Sort[#]] & /@
     Normal[GroupBy[
        ResourceData[
         "Mister Rogers' Sweater Colors"], #Date["Year"] &][[All, All,
        "SweaterColor"]]]}, Transpose[{Keys[data], Values[data]}]],
 Alignment -> {Left, Center}]