Message Boards Message Boards

0
|
6503 Views
|
4 Replies
|
0 Total Likes
View groups...
Share
Share this post:

[?] Get rid of extra disks?

Posted 7 years ago

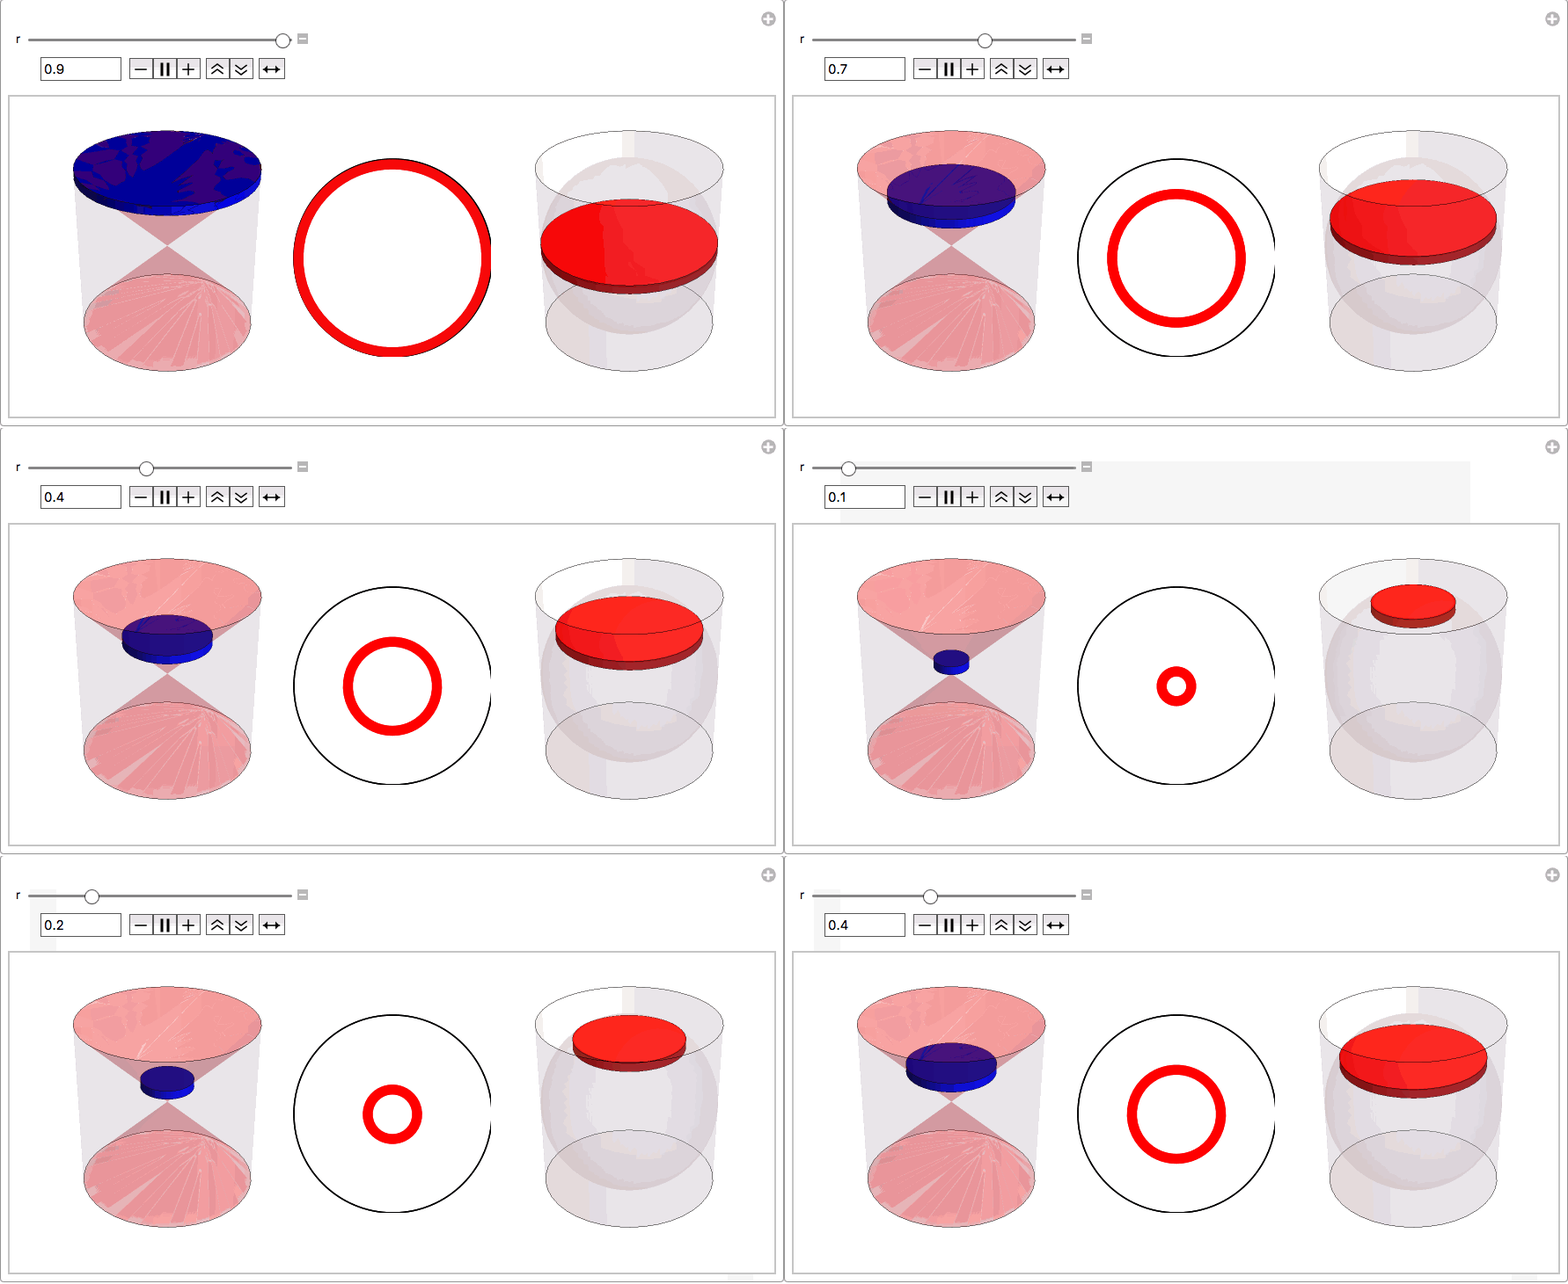
Hi I'm making this presentation, which is showing thee Archimedes hat theorem, and i want to show the disks of same area as the hollow red annulus and i want to show only one disk at a time as i move my manipulate button. I'm attaching the file, i want to show only one disk from table 'c' at a time but i'm not able to please help me out. Regards also if you can make the sizes correct, i''d really appreciate that. Regards

Attachments:
POSTED BY: Muhammad Afzal
4 Replies
Posted 7 years ago

No need for a Table if you show only one disk. here is the adapted Manipulate (I left the third Graphics out because it shows the same as 4?)

Manipulate[
 bas = Graphics3D[{Opacity[.1], Cylinder[{{0, 0, -1}, {0, 0, 1}}, 1], 
    Opacity[.2], Red, Cone[{{0, 0, -1}, {0, 0, 0}}], 
    Cone[{{0, 0, 1}, {0, 0, 0}}]}, ViewPoint -> {Pi, Pi/2, 2}, 
   Boxed -> False, AspectRatio -> Automatic, ImageSize -> 200];
 bas1 = Graphics3D[{Opacity[.1], Cylinder[{{0, 0, -1}, {0, 0, 1}}, 1],
     Sphere[]}, ViewPoint -> {Pi, Pi/2, 2}, Boxed -> False, 
   AspectRatio -> Automatic, ImageSize -> 200];
 b = Graphics3D[{Blue, Cylinder[{{0, 0, r}, {0, 0, r + .1}}, r + .1]},
    AspectRatio -> Automatic, PlotRange -> 1, ImageSize -> 200];
 a = Graphics3D[{Red, 
    Cylinder[{{0, 0, 1 - r}, {0, 0, -r + 0.9}}, 
     Sqrt[1 - (.99 - r)^2]]}, ViewPoint -> {Pi, Pi/2, 2}, 
   Boxed -> False, AspectRatio -> Automatic, PlotRange -> 1, 
   ImageSize -> 200];
 d = Table[
   Graphics[{Circle[{0, 0}, 1], Red, 
     Annulus[{0, 0}, {r + .0001, r + .1}]}, AspectRatio -> Automatic, 
    PlotRange -> 1, ImageSize -> 150], {x, r, r + .1, 0.1}];
 (*c=Table[Graphics[{EdgeForm[Thin],Red,Disk[{0,0},{Sqrt[1-x^2],Sqrt[\
1-x^2]}]},AspectRatio\[Rule]Automatic,ImageSize\[Rule]150],{x,r,r,0.1}\
];*)
 Row[{Show[bas, b], Show[d], Show[bas1, a]}], {r, 0, .9, 0.1}, 
 TrackedSymbols :> True]
GIF

An interesting improvement would be if you change the position of the cylinders from { {0,0,r},{0,0,r+.1}} to { {0,0,r-.05},{0,0,r+.05}} This would show a more accurate picture.

POSTED BY: Erik Mahieu
Posted 7 years ago

That's a great explanation Erik, I really appreciate this idea you have given to me. Thank you very much

POSTED BY: Muhammad Afzal

This shows only one disk at a time, with minimal change from your code:

c = Table[
   Graphics[{EdgeForm[Thin], Red, Disk[{0, 0}, Sqrt[1 - x^2]]}, 
    AspectRatio -> Automatic, ImageSize -> 150, 
    PlotRange -> 1], {x, {r}}];

Is that the disk you wanted?

POSTED BY: Gianluca Gorni
Posted 7 years ago

Thank you very much Gianluca, it works perfectly fine for me

POSTED BY: Muhammad Afzal
Reply to this discussion
Community posts can be styled and formatted using the Markdown syntax.
Reply Preview
Attachments
Remove
or Discard

Group Abstract Group Abstract