Dig In
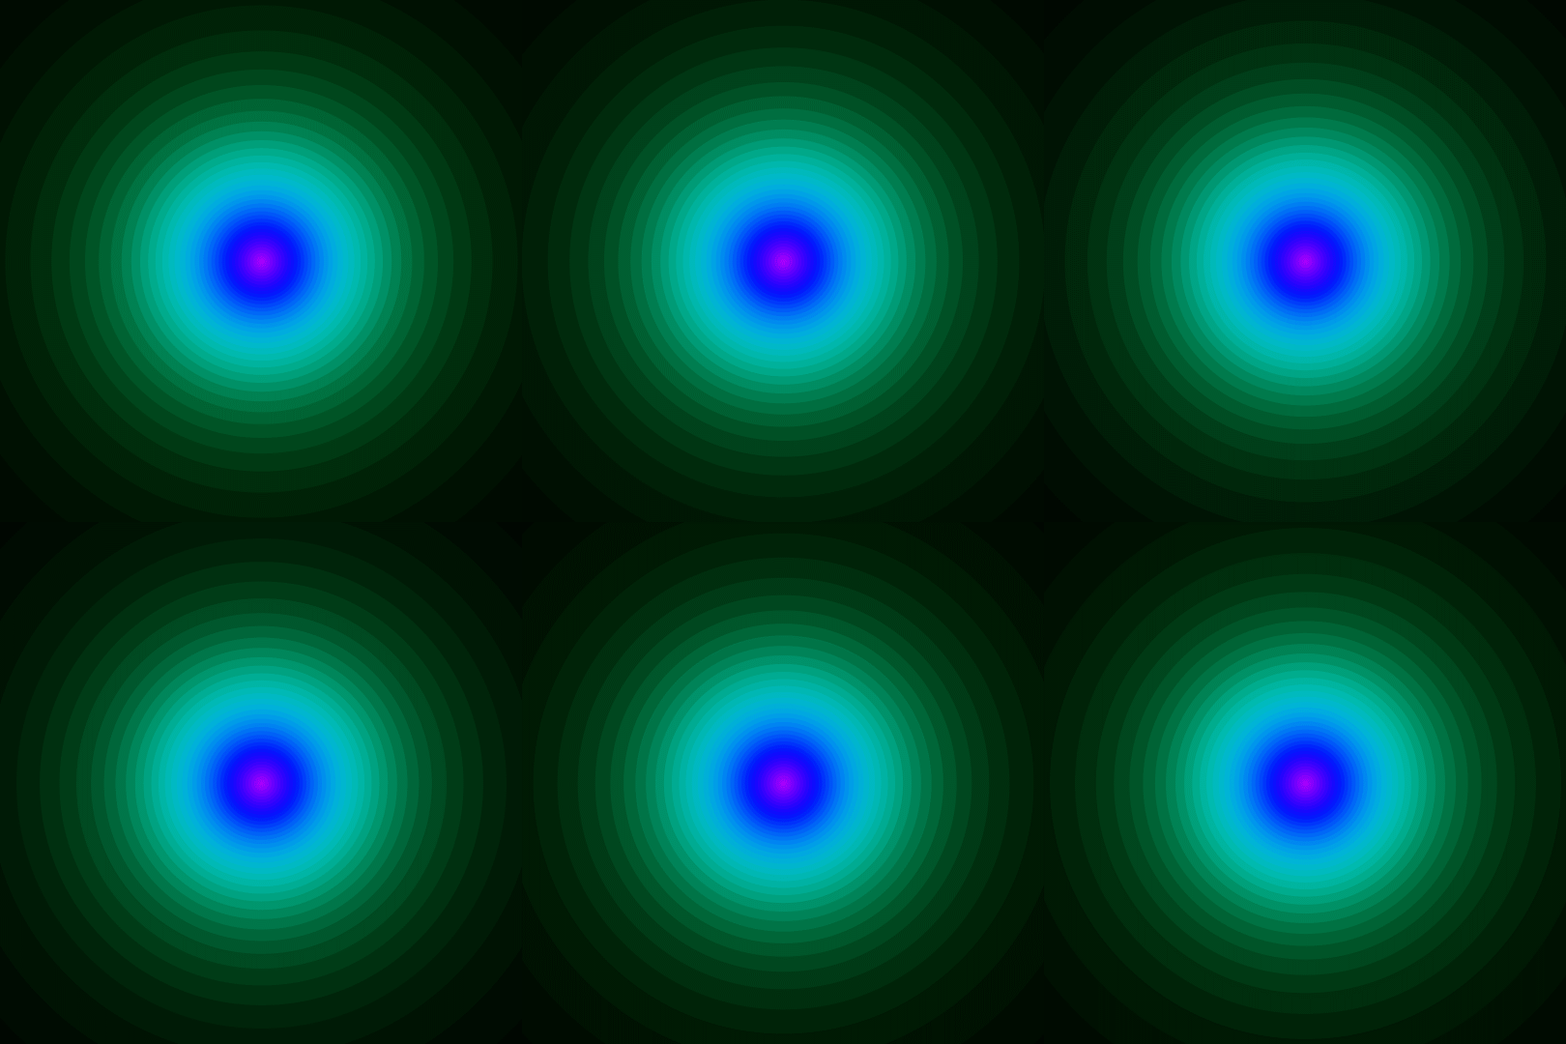
Similar to Interference: in this case, I'm just taking the stereographic images of concentric circles centered at $(0,0,1)$ on the sphere. It's a simple calculation to see that the circle of (spherical) radius $r$ centered at the north pole is mapped by stereographic projection to a circle of radius $\frac{\sin r}{1-\cos r}$ in the plane, so those are the circles actually shown in the animation.
Here's the code:
DynamicModule[{cols = {White, Black}, n = 48},
 Manipulate[
    Graphics[{cols[[1]], Thickness[.002],
      Table[{Hue[(r + s)/(2 Pi) + .3],
        Opacity[.2 (1 - Cos[r + s])],
        Disk[{0, 0}, Sin[r + s]/(1 - Cos[r + s])]},
       {s, Pi/n, Pi, Pi/n}]},
     PlotRange -> 3, ImageSize -> 540, Axes -> None,
     Background -> cols[[-1]]],
    {r, 0., -Pi/n - #, #}] &[-Pi/(40 n)]
 ]