Image Dataset
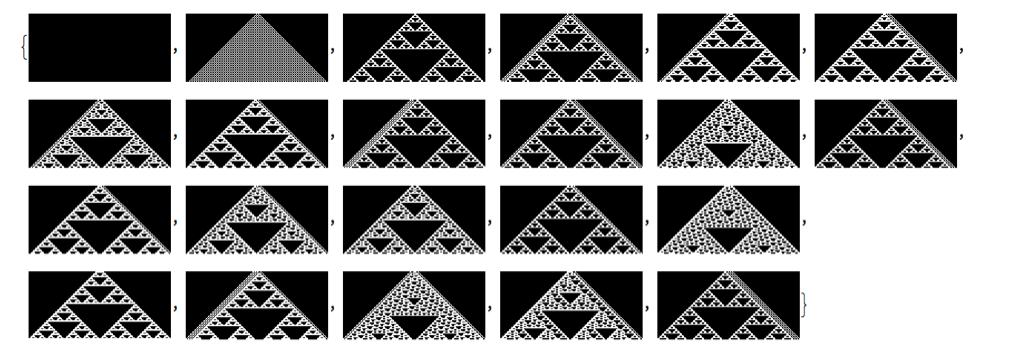
The dataset used in the experiment was generated by creating a set of images of a cellular automata with initial conditions from 0 to 60 in a background of 0's. The set was then binarized to allocate two possible values for each pixel. A 3D representation of rules 0 to 255 were created and stored in files along with measures for each image. 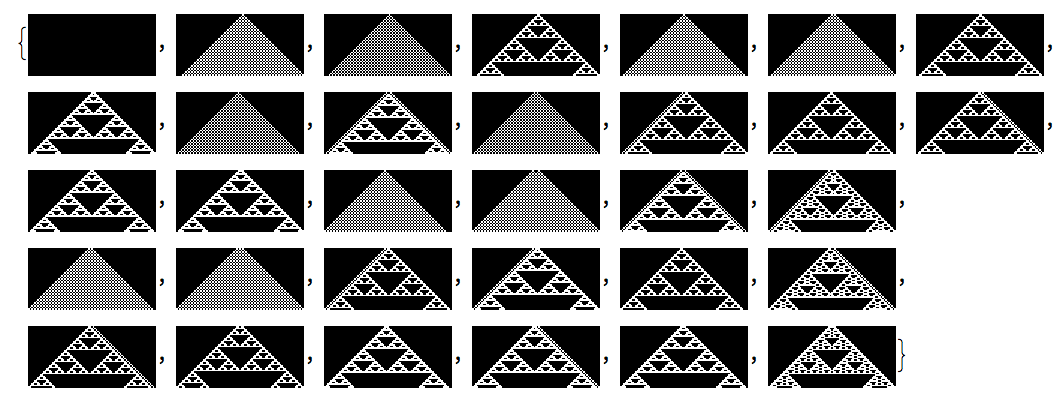
generateMatrix[rule_, steps_, p_] :=
    ruleImage[rule] = Table[
       Binarize[
         Image[CellularAutomaton[
          rule,
          {IntegerDigits[i, 2, p], 0},
          {steps, All}
         ]]],
    {i,0,2^p-1}
]
Feature Extraction
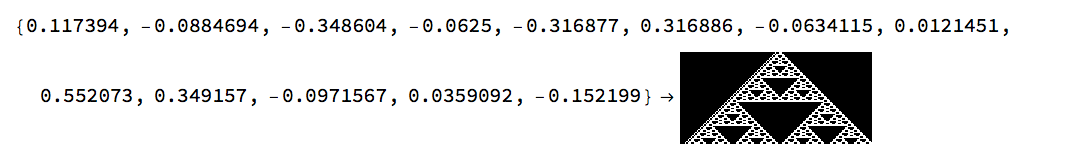
A function generateVectors were used to create a vector of features for each image in the dataset based on its attributes. Those attributes were acquired by invoking the ComponenMeasures function from the Mathematica Image Processing toolbox and the implementation of a HuMoments function. The first set of measures include properties of the image, such as its area, Euler number, bounding box, filled count, convex area, etc, while the second function computes the images moment invariants. The resulting features were stored on an n x m matrix, where n is the number of of images and m is the number of features. This matrix was used as input during the clustering phase. For the experiments the features that were used included solidity, axis ratio, perimeter-area ratio, eccentricity, extent, and invariant moment 7th (skew invariant).
- Solidity: Ratio between the image area and its convex hull area. The area refers to the number of pixels in the foreground region and the convex hull makes reference to the number of pixels of the convex polygon that can contain the same region with the smallest area.
- Axis Ratio: Refers to the ratio between the minor and major axis length (in pixels) of the image. The first one refers to the smaller axis of the best-fit ellipse while the second one gives the length of the largest.
- Areas Ratio:Ratio between the image area and the number of elements after filling holes (FilledCount). This feature represents the presence or absence of holes in the picture.
- Perimeter-Area Ratio: Ratio between the perimeter and the are of the image.
- Eccentricity: Refers to the eccentricity of the best-fit ellipse. In other words, the distance between the foci of the ellipse and its major axis length.
- Extent: Ratio between the area (pixels in foreground region) and pixels in the total bounding box.
- Invariant Moment 7th: Refers to the skew invariant. This moment seems to establish more difference between classes and therefore emphasizes their dissimilarities. This measurement is useful given the nature of variance within a consecutive cellular automata rows related to translation and scale.
Cluster Analysis
Cluster analysis was used as an unsupervised method to try to recognize the underlying structure in the data, not only for classification and pattern recognition but also for with the objective of reduction and optimization (further implementation required). To complete the experiment KMeans was used as the clustering method. Given that it requires the number of clusters as the input, the method NeighborhoodContraction and StandardDeviation criterion function were used to estimate k. After testing clustering with different methods, NeighborhoodContraction seemed to provide a better number of clusters, in addition it is considered to provide a good heuristic for centroid distances in the field.
k = Length@FindClusters[
       r[ruleNum], Method->"NeighborhoodContraction",
       CriterionFunction->"StandardDeviation"
];
FindClusters[
    features->Thread[features->ruleImage[ruleNum]],
    k, Method->"KMeans"
];
 Cluster analysis was performed for every rule using 60 initial conditions and 2^i-1 steps (in order to generate same dimension images) for i <= 5 <= 10. All the data was collected and stored. Further experimentation includes the analysis of cluster variance as the number of steps increases exponentially. These set of files are the first step towards that goal. Furthermore, given the small amount of features that were known a priori, k can be better optimized by using a bigger amount of features or by computing internal and external criteria (such as the Silhoutte index, the Calinski-Harabasz index and C-Index) after clustering the data n times.


