Background
The mathematics genealogy project is a website that collect data of mathematician and who is his/her adviser and student. Here one can trace their academic line all the way back to Newton's era. With an impressive number of entries (213588 people by July 5th 2017), I'm interested to take a closer look of their data to get an insight to mathematics community.
The website can be accessed here: https://www.genealogy.math.ndsu.nodak.edu/index.php
Data Scraping
First step of the project is to get accessed to the data and turn it into Wolfram Language format. My approach is by downloading the html of each page and parse it to get information that we wanted. I chose not to do XML after noticing that there are some variations in the structure of each page.
Each mathematician's page has a unique ID number that differentiate it from others, thus we can access all information just by changing the ID number:

The function that I use to download each page is URLSubmit, which access the page in parallel instead of doing it sequentially. This means the functions make several request to the server and downloading the html code at once rather than accessing it one by one. It comes at the price of messing up with the order of the request (you can get ID 1, then jumping to ID 100 instead of doing it from 1-100 sequentially), but it's okay since we can order it later.
receivedPages = {};

receiveHTML[html_, id_] := Module[{},
  AppendTo[receivedPages, {html[[1]], id}]
  ]

failHTML[html_, id_] := Module[{},
  {"<p>You have specified an ID that does not exist in the database. \
Please back up and try again.</p>", id}
  ]

    startDownload[id_] := Module[{},
      URLSubmit[
       "https://www.genealogy.math.ndsu.nodak.edu/id.php?id=" <>
        ToString[id],
       HandlerFunctions -> <|
         "BodyReceived" -> (receiveHTML[#["Body"], id] &),
         "ConnectionFailed" -> failHTML|>,
       HandlerFunctionsKeys -> {"Body"}]
      ]
Some caution is needed with the speed since if we make too much request at once it will crash and return an error instead. My approach is to put random pause every 5 pages (I tried to do every 10 pages before, but half of the time it gives me database error instead). Another thing to note is not to download all 200,000 pages at once. Good chances it will crash your kernel. Usually I like to to download about 10-20 thousand at once. Since it can take a while (around 20 minutes for 10,000 pages with random pause every 5), I like to use function Monitor to see my progress.
receivedPages = {};
Monitor[
  Table[
   startDownload[i];
   If[Divisible[i, 5],
    Pause[RandomReal[{0, 1}]]], {i, 1, 217304}],
  {i, ProgressIndicator[i, {1, 217304}]}
  ] // AbsoluteTiming
All the downloaded html will go to the list receivedPages. Now we need to parse the html to get our data. The full description of the parser is long and tedious, so I won't put it here. You can see the full code in my notebook at the end of this post. Essentially, I'm mapping the function stringParser to receivedPages to get the data base. This will be fairly big, so we want to write it to separate file in case our kernel crashes.
file = FileNameJoin[{NotebookDirectory[], "Final Database.m"}]

stream = OpenAppend[file]

listAssoc = Map[stringParser, receivedPages]

writer[data_] :=
 Module[
  {i = Length[data], k = 1},
  While[k <= i,
   WriteString[stream, InputForm[data[[k]]]];
   WriteString[stream, ",\n"];
   k++
   ]
  ]

writer[listAssoc]
This will write the data that we have downloaded into Final Database.m (which will be created automatically). Now simply repeat the download process until we get all pages. After that, we can simply Import it to our kernel and put it as a dataset. Some important notes are:
- The data is not properly ordered by ID. We want this to be ordered as it will make calling a certain ID much faster by taking the order it appears in dataset.
- Some ID are not assigned to anyone. For example, by July 5th 2017, ID 206 is not assigned to anyone. By default the function I describe will give "No Mathematician has been assigned to this ID yet" in the "Name" column. Don't delete it for similar reason as note 1.
Analyzing Data
Now we get the data, it will have this structure: 
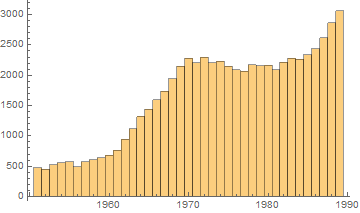
We can start playing around. The first thing that I do is to take a histogram of those that get their title between 1950-1990.
listYear =
 finalData[All, "Personal Information", 1, "Year"] // Normal //
  ToExpression

Histogram[Select[listYear, 1950 < # < 1990 &]]
I get the following result

This is quite interesting as it seems that there are certain point in history where there is a sudden increase of mathematician. Here it happens in 1962-1970, where the gradient took a drastic changes. To figure out what happens, we need to go back 5 years before, since on average it took 5 years to get a PhD. It turns out there is an important event that happens in 1957: Sputnik! During 1950s, the US government is preparing to launch an education initiative, but after Sputnik's launch in 1957 the program takes top priority realizing US is falling behind of Soviet in technology. So 1958 the US congress increased funding towards education. More info can be found here:
https://www.senate.gov/artandhistory/history/minute/SputnikSpursPassageofNationalDefenseEducation_Act.htm
There are other bumps, but I haven't got the chance to further research it. I would love it if anyone can help to explain the sudden stop in 1970s and a huge increase in late 1980s.
Next is I want to found out the country distribution of our data.
countryYear =
 finalData[All, "Personal Information", 1, {"Country", "Year"}]

amountPerCountry[year_] := Module[{data, listCountry, howMany},
  data = countryYear[Select[#Year == ToString[year] &]][All,
    "Country"];
  listCountry = data // DeleteDuplicates // DeleteMissing;
  howMany[country_] :=
   country ->  Length[Select[data, # == country &]];
  Map[howMany, listCountry] // Normal // Association // Dataset
  ]

createChart[year_] :=
 BarChart[amountPerCountry[year][[1 ;; 20]],
  ChartLabels -> Placed[Automatic, Automatic, Rotate[#, 90 Degree] &]]

createMap[year_] := Module[{countryTally, countryEntities, toMap},
  countryTally = amountPerCountry[year];
  countryEntities =
   Interpreter["Country" | "AdministrativeDivision" ][
    Keys[Normal[countryTally]]];
  toMap =
   AssociationThread[countryEntities -> Values[Normal[countryTally]]];
  GeoRegionValuePlot[toMap, ColorFunctionScaling -> False,
   ColorFunction -> (x \[Function]
      ColorData["DarkRainbow"][(x/270)^(1/4)])]
  ]
Okay, let's test it on 2014 data 
It seems that our data is heavily biased towards American, as we can see America has a gigantic figure compared to everybody and Russia is shown to be the same level as Argentina/Norwegia. This doesn't seems to fit our experience where Russian plays a major part in the mathematics community. The bias probably is caused because it's not popular in Russia, so people doesn't submit their information.
Some other observation is the fact that majority of Africa doesn't have any data. It can be either bias in database, or mathematics community really has not developed in Africa. Personally, I think it is more towards the later options, but I would love to hear opinions regarding this.
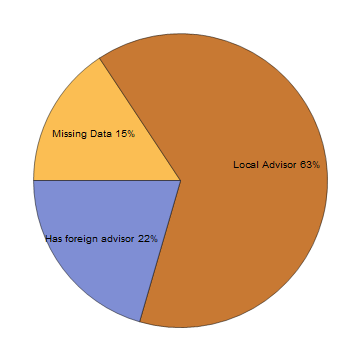
One thing that I'm always curious is how the community develop. If we go back to history, often mathematics idea come from a certain country, then spread around to other country, which then the new country will develop their own mathematics idea. A good example is how Algebra spread Middle East to Italy by Fibonacci, which then sparks more works about the subject leading to the solution of 3rd degree polynomial. Using the database, I'm trying to see the progression of knowledge between country by identifying mathematician who has an adviser from different country. Since the code is somewhat long, I'll just post the result, and the source code can be seen in the notebook.
Here is the percentage of mathematician with foreign adviser among everyone in the database: 
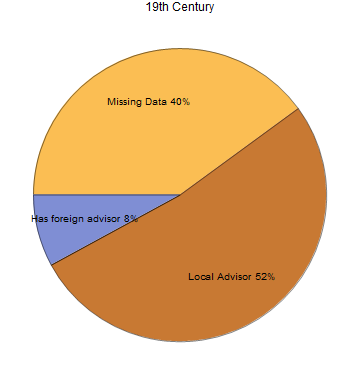
Surprisingly high number of mathematician has a foreign adviser! It seems mathematics is an international business. Still, this result might be biased since the majority of our data come from 20th Century USA. Trying the same approach towards those in 19th century, we get more conservative result:

Only 8% of mathematician is confirmed to have foreign adviser in 19th century. It is still possible for this number to grow since there are 40% missing data. Still, it shows how the advent of technology makes it easier for ideas to spread. Of course, there are various things to be explored in this direction, but because of time constraint this is the result that I get so far. I would love to hear more ideas how to explore this.
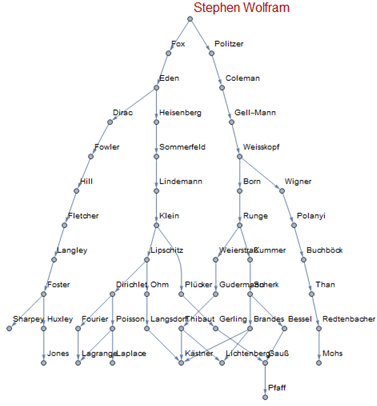
My last work is to create a genealogy tree of someone's adviser(s). Here is the code used:
getAdvisor[id_Integer] :=
 Module[{advisor =
    finalData[id]["Personal Information", All, "Advisor"] // Normal //
      Flatten},
  ToExpression@DeleteMissing[advisor]
  ]

goBack[id_] := Map[id -> # &, getAdvisor[id]]

createTree[id_, generation_] := Module[{list, i, assoc},
  list = {{id}};
  i = 1;
  While[i <= generation,
   list = Join[list, {Map[getAdvisor, (list[[i]] // Flatten )] } ];
   i++
   ];
  assoc = Map[goBack, list // Flatten // DeleteDuplicates] // Flatten;
  Graph[assoc,
   VertexLabels ->
    Map[# -> Last@StringSplit[finalData[#, "Name"]] &,
     DeleteDuplicates[Join[Part[assoc, All, 1], Part[assoc, All, 2]]]
     ]
   ]
  ]
Out of respect of Wolfram language, here is the genealogy of Stephen Wolfram up to 10 generations 
And that concludes my current result of exploration. For future directions, I have a list of ideas that I would like to try:
- Model how mathematics community develop
- Explore trend of subject by country and year
- Correlation between advisor's and student's dissertation topic
- Analysis of MathSci Net
- Use Machine Learning to identify person' s heritage from his/her name, then use it to analyze how it affects the person descendants
If you have any suggestion/comments, I would love to hear it. Hope you guys enjoy the post!