Analysis of the U.S. Government Foreign Assistance
Goal of the project
First of all we would like to point out that this is a preliminary analysis which aims at analyzing data from the website foreignassistance.gov, i.e. the U.S. government's main tool for improving transparency in U.S. foreign assistance spending. We work toward understanding U.S. foreign assistance investments in a sample of countries. The aid to Peru, Jordan and Ethiopia for the range of years 2013 - 2016 will be discussed in more details.
Motivation
The U.S. spends many billion on foreign assistance every year to improve health, support democracy and other categories, and achieve other U.S. foreign policy goals. Besides enabling stakeholders and the general public to better understand U.S. foreign assistance investments around the world, this analysis can be priceless to project implementers and managers to effectively manage these funds.
Summary of work
After having imported data via the API and having selected the important information by using the main functions for data analysis, we have displayed our results through the functions BarChart, PieChart and ListLogPlot.
Remark
The code has been written for being independent from the particular data set under investigation. Thus, we can perform the same analysis for any country of our sample. For sake of clarity, we focus on Peru, Jordan and Ethiopia and we display how the investments are distributed into these countries over the studied range of years. In this analysis we deal with certain categories which receive financial aid from certain U.S. agencies. Below we have listed such agencies and categories.
Categories
1) Economic Development 2) Peace and Security 3) Program Management 4) Multi-sector 5) Education and Social Services 6) Democracy, Human Rights, and Governance 7) Humanitarian Assistance 8) Health 9) Environment
Agencies
1) Department of Agriculture 2) Department of Commerce 3) Department of Defense 4) Department of Energy 5) Department of Health and Human Services 6) Department of Homeland Security 7) Department of the Interior 8) Department of Justice 9) Department of Labor 10) Department of State 11) Department of the Treasury 12) Department of Transportation 13) Environmental Protection Agency 14) Federal Trade Commission 15) Inter-American Foundation 16) Millennium Challenge Corporation 17) Peace Corps 18) U.S. African Development Foundation 19) U.S. Agency for International Development 20) U.S. Trade Development Agency
Importing data via API
listCountrySample =
  Flatten@StringCases[
    CommonName[EntityList[EntityClass["Country", All]]],
    StartOfString ~~ WordCharacter .. ~~ EndOfString];

datasetsCS2016 =
  Cases[Map[# ->
      URLExecute[
       "http://fagov-api-prod.azurewebsites.net/api/public/\
activities", {"format" -> "json", "fundingType" -> "obligated",
        "filterType" -> "location", "filterValue" -> #,
        "year" -> "2016"}, "RawJSON"] &,
    listCountrySample], _[_, _List]];

datasetsCS2015 =
  Cases[Map[# ->
      URLExecute[
       "http://fagov-api-prod.azurewebsites.net/api/public/\
activities", {"format" -> "json", "fundingType" -> "obligated",
        "filterType" -> "location", "filterValue" -> #,
        "year" -> "2015"}, "RawJSON"] &,
    listCountrySample], _[_, _List]];

datasetsCS2014 =
  Cases[Map[# ->
      URLExecute[
       "http://fagov-api-prod.azurewebsites.net/api/public/\
activities", {"format" -> "json", "fundingType" -> "obligated",
        "filterType" -> "location", "filterValue" -> #,
        "year" -> "2014"}, "RawJSON"] &,
    listCountrySample], _[_, _List]];

datasetsCS2013 =
  Cases[Map[# ->
      URLExecute[
       "http://fagov-api-prod.azurewebsites.net/api/public/\
activities", {"format" -> "json", "fundingType" -> "obligated",
        "filterType" -> "location", "filterValue" -> #,
        "year" -> "2013"}, "RawJSON"] &,
    listCountrySample], _[_, _List]];
where "listCountrySample" is our sample of countries.
First analysis
In this first section we discuss how U.S. Government Foreign Assistance has been distributed by the U.S. agencies during the range of years 2013 - 2016. Although the code below has been written for any country, any category and any category, we employ it for investigating the category Health of Ethiopia and Peru. As a result, we find out both which agencies have donated and their donations. We would like to stress that this analysis is considered our most complete one in the sense that information about categories and agencies can be extracted at the same time.
Unique data set
For our purpose we create a data set which contains data for all the studied year and countries.
datasetAll201316d1 =
  Join[dataAlltogether2016, dataAlltogether2015, dataAlltogether2014,
   dataAlltogether2013];
where the data sets dataAlltogether2016, dataAlltogether2015, dataAlltogether2014, dataAlltogether2013 are defined as follows:
dataAlltogether2016 = Flatten@Values[datasetsCS2016];
dataAlltogether2015 = Flatten@Values[datasetsCS2015];
dataAlltogether2014 = Flatten@Values[datasetsCS2014];
dataAlltogether2013 = Flatten@Values[datasetsCS2013];
and represent the data sets of 2016, 2015, 2014 and 2013, respectively.
Code explanation
In order to understand the evolution of the financial support for a specific country, we have to take into account a country which has non-zero data for all the studied year.
Intersecting countries with non-zero data:
coutr2016 =
  DeleteDuplicates[
   Table[dataAlltogether2016[[i]][["BenefitingLocation"]], {i, 1,
     Length[dataAlltogether2016]}]];
coutr2015 =
  DeleteDuplicates[
   Table[dataAlltogether2015[[i]][["BenefitingLocation"]], {i, 1,
     Length[dataAlltogether2015]}]];
coutr2014 =
  DeleteDuplicates[
   Table[dataAlltogether2014[[i]][["BenefitingLocation"]], {i, 1,
     Length[dataAlltogether2014]}]];
coutr2013 =
  DeleteDuplicates[
   Table[dataAlltogether2013[[i]][["BenefitingLocation"]], {i, 1,
     Length[dataAlltogether2013]}]];

Intersection[coutr2013, coutr2014, coutr2015, coutr2016]

{"Afghanistan", "Albania", "Algeria", "Angola", "Argentina", \
"Armenia", "Azerbaijan", "Bahamas, The", "Bangladesh", "Barbados", \
"Belarus", "Belize", "Benin", "Bolivia", "Botswana", "Brazil", \
"Brunei", "Bulgaria", "Burundi", "Cambodia", "Cameroon", "Chad", \
"Chile", "China", "Colombia", "Comoros", "Croatia", "Cuba", "Cyprus", \
"Djibouti", "Dominican Republic", "Ecuador", "Egypt", "Eritrea", \
"Estonia", "Ethiopia", "Fiji", "Gabon", "Gambia, The", "Georgia", \
"Ghana", "Guatemala", "Guinea", "Guinea-Bissau", "Guyana", "Haiti", \
"Honduras", "Hungary", "India", "Indonesia", "Iraq", "Israel", \
"Jamaica", "Japan", "Jordan", "Kazakhstan", "Kenya", "Kosovo", \
"Kyrgyzstan", "Laos", "Lebanon", "Lesotho", "Liberia", "Libya", \
"Lithuania", "Macedonia", "Madagascar", "Malawi", "Malaysia", \
"Maldives", "Mali", "Mauritania", "Mauritius", "Mexico", "Micronesia, \
Federated States of", "Moldova", "Mongolia", "Montenegro", "Morocco", \
"Mozambique", "Namibia", "Nepal", "Nicaragua", "Niger", "Nigeria", \
"Pakistan", "Panama", "Papua New Guinea", "Paraguay", "Peru", \
"Philippines", "Romania", "Russia", "Rwanda", "Samoa", "Senegal", \
"Serbia", "Seychelles", "Slovakia", "Somalia", "South Sudan", \
"Sudan", "Swaziland", "Syria", "Tajikistan", "Tanzania", "Thailand", \
"Togo", "Tonga", "Tunisia", "Turkey", "Turkmenistan", "Uganda", \
"Ukraine", "Uruguay", "Uzbekistan", "Vanuatu", "Venezuela", \
"Vietnam", "Yemen", "Zambia", "Zimbabwe"}
Ethiopia and Peru seem to be good targets for our purpose.
Counting how many countries are in the sample of countries of each year:
{Length[coutr2016], Length[coutr2015], Length[coutr2014],
 Length[coutr2013]}

{136, 142, 132, 136}
Interpreting US currency:
AnalysisAmountNew1 =
  MapAt[Interpreter[Restricted["StructuredQuantity", "USDollars"]],
   datasetAll201316d1, {1 ;;, 2}];
Neglecting data with "Amount = 0 USDollars":
AnalysisAmountNewOhneZero1 =
  DeleteCases[AnalysisAmountNew1[[;; All]],
   x_?(QuantityMagnitude[#Amount] == 0 &)];
Selecting relevant data:
countryAnalysisNew[category_, year_, agencyName_, country_] :=
  With[{r =
     Select[Select[
       Select[Select[
         AnalysisAmountNewOhneZero1, #[[3]] == category &], #[[4]] ==
          year &], #[[1]] == agencyName &], #[[5]] == country &]},
   If[Length[r] ==
     0, {Association[Rule["AgencyName", ""], Rule["Amount", "0.00"],
      Rule["Category", ""], Rule["Year", ""],
      Rule["BenefitingLocation", ""], Rule["Sector", ""]]}, r]];
Computing the total amount of finance assistance:
COUNTRYAnalysisAmountNew[category_, year_, agencyName_, country_] :=
  MapAt[Interpreter[Restricted["StructuredQuantity", "USDollars"]],
   countryAnalysisNew[category, year, agencyName, country], {1 ;;, 2}];

countryAnalysisTotUSDollarNew[category_, year_, agencyName_,
   country_] :=
  Total[COUNTRYAnalysisAmountNew[category, year, agencyName,
     country][[All, "Amount"]]];
Making a list of associations to use ListLogPlot function on it and thus visualizing the result:
dtotcountry[category_, agency_, country_] :=
 Map[agency -> {#,
     countryAnalysisTotUSDollarNew[category, ToString[#], agency,
      country]} &, Range[2013, 2016]]

dtotlistCountryNew[category_, country_] :=
  Map[dtotcountry[category, #, country] &,
   DeleteDuplicates[datasetAll201316d1[[All, "AgencyName"]]]];
Functions for plotting:
frameticksLogplot = {{{{10^4,
      "\!\(\*SuperscriptBox[\(10\), \(4\)]\)"}, {10^5,
      "\!\(\*SuperscriptBox[\(10\), \(5\)]\)"}, {10^6,
      "\!\(\*SuperscriptBox[\(10\), \(6\)]\)"}, {10^7,
      "\!\(\*SuperscriptBox[\(10\), \(7\)]\)"}, {10^8,
      "\!\(\*SuperscriptBox[\(10\), \(8\)]\)"}},
    None}, {{2013, 2014, 2015, 2016}, None}};

lpDefenseCountry[category_, country_] :=
 ListLogPlot[Values[dtotlistCountryNew[category, country]][[2]],
  PlotRange -> {All, All}, PlotLegends -> {"Department of Defence"},
  Frame -> True, FrameLabel -> {"Year", $ },
  PlotStyle -> {PointSize[Large], RGBColor[.5, .8, .1]},
  FrameTicks -> frameticksLogplot, PlotLabel -> category]
where frameticksLogplot gives the particular frame ticks we want to have on our charts. With regard to the function lpDefenseCountry[category, country], let us highlight that a similar function has been written for each U.S. agency in order to visualize the obtained results.
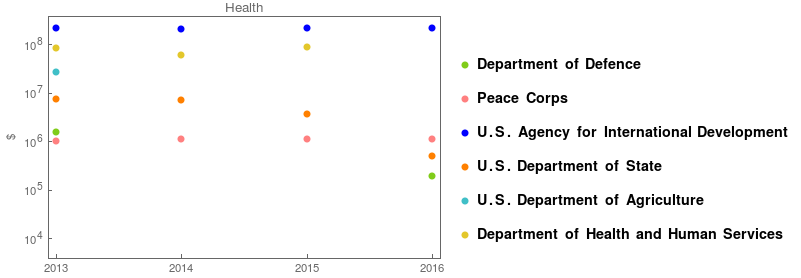
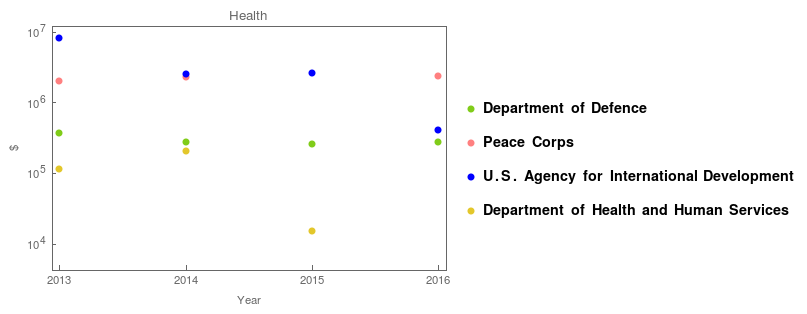
The U.S. Government foreign aid for the category "Health" of Ethiopia and Peru in the usual range of years can be seen in the figures below. The first and the second chart show such an aid in Ethiopia and in Peru respectively. The comparison between these charts gives us the different time evolution of the spending of each involved agency.


Second analysis
In this second section we study how U.S. Government Foreign Assistance has been distributed into the categories that U.S. Government has offered during the range of years 2013 - 2016. Specifically, we are interested in the total amount of donations and in which categories have received it. Consequently, we do not obtain any information about the U.S. agencies unlike the first analysis. Although the code below has been written for any country, any year, we use it for revealing the different aid to Ethiopia and Peru in 2016.
Code explanation
Considering the data set of 2016:
dataAlltogether2016 = Flatten@Values[datasetsCS2016];
Selecting data for a specific country and a specific category:
    AnalysisGivenCountry2016[country_, category_] := With[{r =
     Select[Select[
       dataAlltogether2016, #[[5]] == country &], #[[3]] ==
        category &]},
   If[Length[r] ==
     0, {Association[Rule["AgencyName", ""], Rule["Amount", "0.00"],
      Rule["Category", ""], Rule["Year", ""],
      Rule["BenefitingLocation", country], Rule["Sector", ""]]}, r]];
Interpreting US currency:
DollarIssue2016[country_, category_] :=
  MapAt[Interpreter[Restricted["StructuredQuantity", "USDollars"]],
   AnalysisGivenCountry2016[country, category], {1 ;;, 2}];
Neglecting data with "Amount = 0 USDollars":
DollarIssueOnhe02016[country_, category_] :=
 Cases[DollarIssue2016[country, category],
  HoldPattern[<|_String -> _String, _String ->
     Quantity[Except[0],
      "USDollars"], _String -> _String, _String -> _String, _String \
-> _String, _String -> _String|>]]
Computing the total amount of financial assistance:
total2016[country_] :=
 Association[
  Map[# -> Total[
      Table[DollarIssueOnhe02016[country, #][[i]]["Amount"], {i, 1,
        Length[DollarIssueOnhe02016[country, #]]}]] &, categorieS2016]]

totalpiechartCountry2016[country_] :=
 Total[Values[total2016[country]]]
Displaying the pie chart for a given country:
ModpiechartPais2016[country_] :=
 PieChart[total2016[country],
  ChartLegends -> Keys[total2016[country]],
  PlotLabel -> country (Total[Values[total2016[country]]])]

By comparing the pie charts of Ethiopia and Peru, we can visualize immediately the different choices of investment between these countries which were made in 2016.
Plotting the total amount of U.S. Government Foreign Assistance (e.g. for Peru):
barchartPeru =
 BarChart[{totalpiechartCountry2014["Peru"],
   totalpiechartCountry2015["Peru"],
   totalpiechartCountry2016["Peru"]}, PlotLabel -> "Peru (2014-16)",
  ChartLabels ->
   Placed[{"2014", "2015", "2016"}, Below, Rotate[#, Pi/2.4] &]]

In order to plot this figure we have employed the previous lines of code for Jordan and Ethiopia as well. These charts show an increase of the financial support to Ethiopia in the last two years and a decrease of it to Jordan and Peru.
Third analysis
In this last section we investigate how U.S. Government Foreign Assistance has been distributed into a specific category by a specifc agency in 2015 and 2016. As a result we obtain the time evolution of the U.S. investments. Although this code has been written for any agency and any category, we only report the particular case of Health and Department of Defense, as category and agency under examination. Note that the analysis for all the agencies and all the categories has been performed in the Mathematica notebook ProjectWSS2017_Dradi1.nb. Finally, we would like to stress that the corresponding analysis for 2015 can be performed by running the same notebook with dataAlltogether2015 instead of dataAlltogether2016.
Code explanation
Using dataAlltogether2016 that was defined above, i.e.
dataAlltogether2016 = Flatten@Values[datasetsCS2016];
Selecting associations for a given category, agency and country:
AnalysisNew[category_, agencyName_, country_] :=
  With[{r =
     Select[Select[
       Select[dataAlltogether2016, #[[3]] == category &], #[[1]] ==
         agencyName &], #[[5]] == country &]},
   If[Length[r] ==
     0, {Association[Rule["AgencyName", agencyName],
      Rule["Amount", "0.00"], Rule["Category", category],
      Rule["Year", ""], Rule["BenefitingLocation", country],
      Rule["Sector", ""]]}, r]];
Interpreting US currency:
AnalysisAmountNew[category_, agencyName_, country_] :=
  MapAt[Interpreter[Restricted["StructuredQuantity", "USDollars"]],
   AnalysisNew[category, agencyName, country], {1 ;;, 2}];
Computing total amount of assistance aid:
AnalysisTotUSDollarNew[category_, agencyName_, country_] :=
 Total[AnalysisAmountNew[category, agencyName, country][[All,
   "Amount"]]]
Creating a list of {country,TotAmountDollar} and then an association between agency and this list:
AnalysisAmount[category_, agencyName_] :=
  Map[{#, AnalysisTotUSDollarNew[category, agencyName, #]} &,
   Keys[datasetsCS2016]];

dtot[category_, agencyName_] :=
  Map[agencyName -> {#,
      AnalysisTotUSDollarNew[category, agencyName, #]} &,
   Keys[datasetsCS2016]];
where datasetsCS2016 has been defined in the first analysis.
Neglecting data with "Amount = 0 USDollars" and creating a list of dtot for a give category:
dtotOhne0[category_, agencyName_] :=
 Cases[dtot[category, agencyName],
  HoldPattern[_String -> {_String,
     Quantity[x_ /; x > 0||x < 0, "USDollars"]}]];

amountTotlistNewOhne0[category_] :=
  Map[dtotOhne0[category, #] &, aGENCY];
Let us point out that all the U.S. agencies have been taken into consideration in order to compute the total assistance spending to each categories. The lists aGENCY and categories are defined as follows:
agencies[xDataF_] :=
 DeleteDuplicates[
  Table[Values[Values[Normal[datasetsCS2016[[xDataF]]]]][[i, 1]], {i, 1,
    Length[Values[Normal[datasetsCS2016[[xDataF]]]]]}]]

aGENCY = DeleteDuplicates[
  Flatten@Join[
    Table[agencies[i], {i, 1, Length[Values[Normal[datasetsCS2016]]]}]]];

categorieS
{"Economic Development", "Peace and Security", "Program Management", \
"Multi-sector", "Education and Social Services", "Democracy, Human \
Rights, and Governance", "Humanitarian Assistance", "Health", \
"Environment"}

aGENCY
{"Overseas Private Investment Corporation", "Department of Defense", \
"Peace Corps", "U.S. Agency for International Development", "U.S. \
Department of State", "U.S. Department of the Treasury", \
"Inter-American Foundation", "Department of Interior", "U.S. African \
Development Foundation", "Department of Justice", "Department of \
Labor", "U.S. Department of Agriculture"}
Creating a list of associations which connects the above total spending with the corresponding category (for all the categories):
listamountTOTNewOhne0 =
  Map[# -> Flatten@amountTotlistNewOhne0[#] &, categorieS];
This list is relevant for using this code for any year we are interested in without specifying the category manually.
Functions for plotting:
totMoneyCategAgenc[CategAgenc_] :=
 Table[CategAgenc[[i]][[2]], {i, 1, Length[CategAgenc]}];

countriesCategAgenc[CategAgenc_] :=
 Table[CategAgenc[[i]][[1]], {i, 1, Length[CategAgenc]}];

histPlotFin[CategAgenc_, nameComplAgency_] :=
 BarChart[totMoneyCategAgenc[CategAgenc], ScalingFunctions -> "Log",
  Frame -> True, BarSpacing -> 1, PlotLabel -> nameComplAgency,
  ImageSize -> Large, FrameLabel -> {"", $ },
  ChartLabels ->
   Placed[countriesCategAgenc[CategAgenc], Axis, Rotate[#, Pi/2] &]]
For the category Health:
listMoney6 =
  Map[Cases[Values[listamountTOTNewOhne0[[6]]],
     HoldPattern[# -> {_String,
        Quantity[x_ /; x > 0|| x < 0, "USDollars"]}]] &, aGENCY];

textlistMoney64 = Style[listMoney6[[4]][[1]] // Keys, FontColor -> Red]

New64 = Values[listMoney6[[4]]]

histPlotFin[New64, ToString[textlistMoney64]]
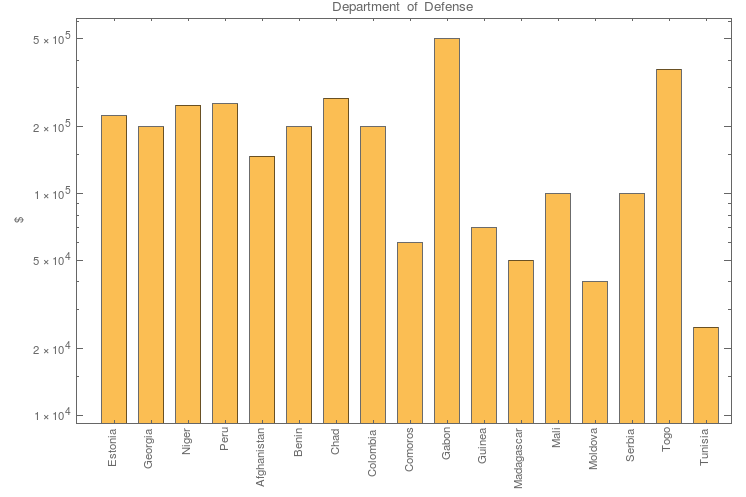
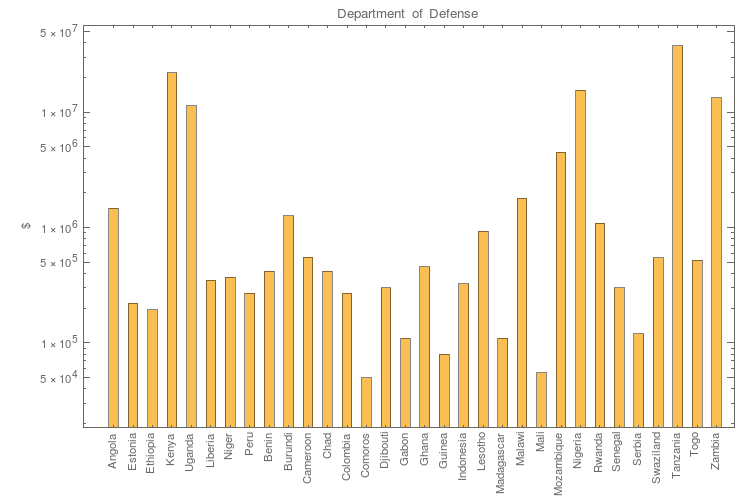
where listMoney6 gives the list of associations <|agency --> {country, total amount of spending}|> for the studied category, textlistMoney64 gives the name of the specific agency under investigation (Department of Defense), New64 gives the lists {country, total amount of spending} in terms of listamountTOTNewOhne0 for the given category and finally histPlotFin draws the bar chart on the bottom of the figure below.


The bar chart on the top of this figure represents total amount of spending of 2015 for the countries which have received aid in the category Health.
Conclusions
Fluctuations in the U.S. foreign assistance spending are clearly visible in our results. Our analysis is able to show the different contributions of the several U.S. agencies to the studied categories of any country of the sample. Even though the code runs slow and thus it can be improved, our results seem to be consistent with those released from the website we used for this analysis.
Future Directions
Possible connections between international presidential trips made by Barack Obama and this analysis would be an interesting topic to be studied. During this work we have found out that there was an increase of U.S. government's commitment towards Ethiopia after President Obama became the first sitting U.S. president to travel to Ethiopia in July 2015. In this regard, we would like to understand by using this analysis whether or not such increases and the presidential trips are connected over the last few years.