Message Boards Message Boards

1
|
36626 Views
|
6 Replies
|
9 Total Likes
View groups...
Share
Share this post:

How do I specify an exact value range in ColorFunction?

Posted 11 years ago
I'm trying to display running cross-correlograms with ListDensityPlot (with time lag on y axis, time on x-axis, and color corresponding to correlation coefficient). I want to use the "Rainbow" color function, such that violet corresponds to a correlation coefficient of -1 and red to +1. I want to set this absolute scale for many different ListDensityPlots so I can directly compare cross-correlograms, but ColorFunction normalizes the data in each plot to run from 0 to 1. I understand I can disable this normalization with ColorFunctionScaling->False, but I still do not know how to establish an absolute color scale that I can use in different plots. Does anyone know how to write such an explicit ColorFunction? Thank you.
POSTED BY: Garrett Neske
6 Replies
Just a tiny little more info. In case that you need other color schemes for actual spectrum with physical meaning, you can go to the menu bar and click "Palettes" -> "Color Scheme" ->"Physical " -> "Visible spectrum".  You can see that the default range for this color data is not from 0 to 1 but from 380 to 750, which corresponding to the physical wave length. 


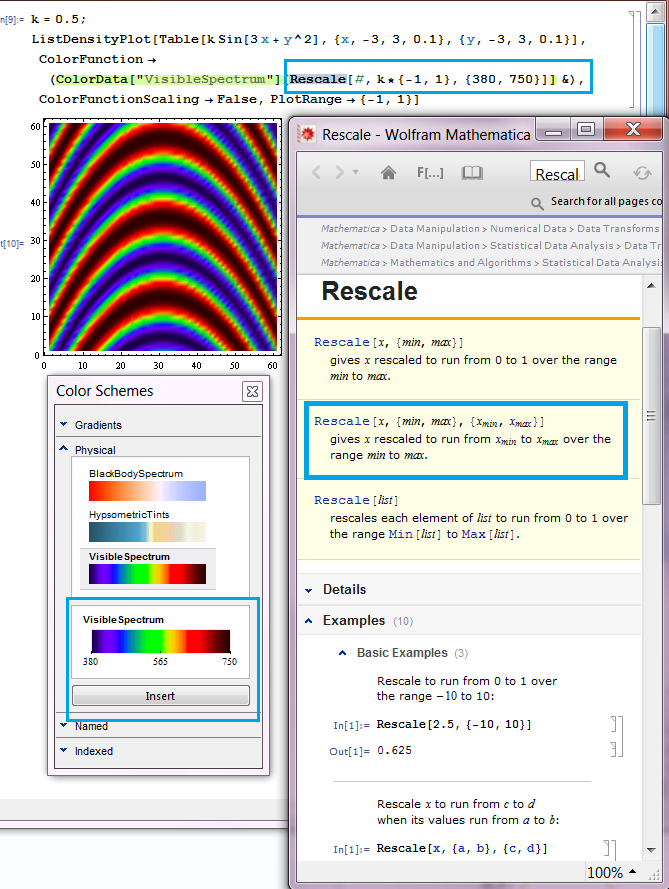
Thus you just need to add a color range in to the Rescale function and it will convert the range of your function to that of the visible spectrum. This is very handy extension to the default cases above. Here is the workable code:
k = 0.5;
ListDensityPlot[
Table[k Sin[3 x + y^2], {x, -3, 3, 0.1}, {y, -3, 3, 0.1}],
ColorFunction -> (ColorData["VisibleSpectrum"][
     Rescale[#, k*{-1, 1}, {380, 750}]] &),
ColorFunctionScaling -> False, PlotRange -> {-1, 1}]
POSTED BY: Shenghui Yang
Something like this would do the trick.
Plot[0.8 Sin[x] + 0.2, {x, 0, 3 \[Pi]},
ColorFunction -> (ColorData["Rainbow"][Rescale[#2, {-1, 1}]] &),
ColorFunctionScaling -> False, PlotRange -> {-1, 1}]

POSTED BY: Sander Huisman
This is Sander's idea applied to ListDensityPlot
Table[

ListDensityPlot[
  Table[k Sin[3 x + y^2], {x, -3, 3, 0.1}, {y, -3, 3, 0.1}],
  ColorFunction -> (ColorData["Rainbow"][Rescale[#, {-1, 1}]] &),
  ColorFunctionScaling -> False, PlotRange -> {-1, 1}]

, {k, {.5, 1}}]

POSTED BY: Vitaliy Kaurov
Posted 11 years ago
Thank you.  Your suggestion worked.
POSTED BY: Garrett Neske
Posted 2 years ago

Could anyone explain this statement: Rescale[#, {-1, 1}, {380, 750}]] &)

What is # and &)?

POSTED BY: Samir Tohme

Lookup the function Function in the documentation: https://reference.wolfram.com/language/ref/Function.html

There are several notations one of them with # and &, basically # will be the 'input" and & denotes that it is a "pure" or lambda function.

POSTED BY: Sander Huisman
Reply to this discussion
Community posts can be styled and formatted using the Markdown syntax.
Reply Preview
Attachments
Remove
or Discard

Group Abstract Group Abstract