A (very) Brief Introduction...
Simply (literally): these sites allow users to create and email custom graphing paper from available graph types. Options include range/size, style, & colour.
This post will go over the steps gone through to make these websites from creating the individual graphs to putting them on websites.
Coordinate Grid:
First Objective: Making the Basic Graph with Axis
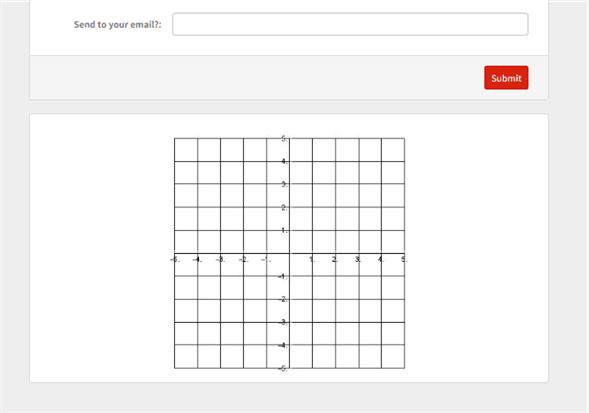
Using PlotRange, I began by creating a grid with x & y ranges of -5 to 5 and -6 to 6 called "graph" (No axes shown):
Here, the gridlines are placed at intervals of 1
graph = Graphics[{}, PlotRange -> {{-5, 5}, {-6, 6}},
     GridLines -> {Range[-5, 5, 1], Range[-6, 6, 1]}]
To change the aspect ratio of the overall graph (depending on desired size of graph) added: AspectRatio-> ___
graph = Graphics[{}, PlotRange -> {{-5, 5}, {-6, 6}},
     GridLines -> {Range[-5, 5, 1], Range[-6, 6, 1]}, AspectRatio -> 6/5]
Added an axes and to change the interval of ticks: Axes->___ & Ticks->{_,_}
   graph = Graphics[{}, PlotRange -> {{-5, 5}, {-6, 6}},
         GridLines -> {Range[-5, 5, 1], Range[-6, 6, 1]},  AspectRatio -> 6/5, Axes -> True,Ticks -> {Range[-5, 5, 1], Range[-6, 6, 1]}]
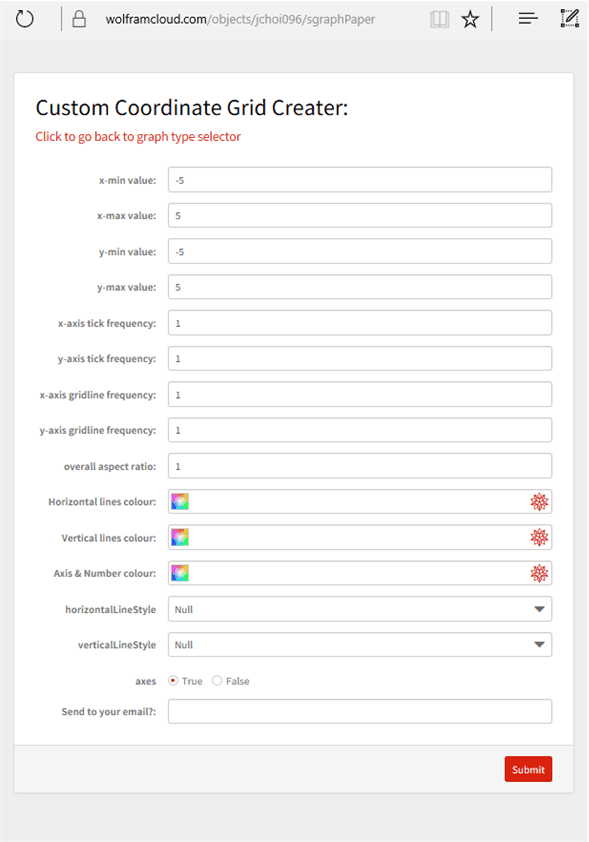
Since this will eventually be customizable on a website, I used FormPage for user input and called it "square". Stand-in values were replaced and input labels and default inputs were also placed:
  square = FormPage[{"xi" -> <|"Interpreter" -> "Real",
        "Label" -> "x-min value:", "Input" -> -5|>,
      "xa" -> <|"Interpreter" -> "Real", "Label" -> "x-max value:",
        "Input" -> 5|>,
      "yi" -> <|"Interpreter" -> "Real", "Label" -> "y-min value:",
        "Input" -> -5|>,
      "ya" -> <|"Interpreter" -> "Real", "Label" -> "y-max value:",
        "Input" -> 5|>,
      "xt" -> <|"Interpreter" -> "Real",
        "Label" -> "x-axis tick frequency:", "Input" -> 1|>,
      "yt" -> <|"Interpreter" -> "Real",
        "Label" -> "y-axis tick frequency:", "Input" -> 1|>,
      "fx" -> <|"Interpreter" -> "Real",
        "Label" -> "x-axis gridline frequency:", "Input" -> 1|>,
      "fy" -> <|"Interpreter" -> "Real",
        "Label" -> "y-axis gridline frequency:", "Input" -> 1|>,
      "axes" -> {True, False},
      "ar" -> <|"Interpreter" -> "Real",
        "Label" -> "overall aspect ratio:", "Input" -> 1|>}, {graph =
        Graphics[{}, PlotRange -> {{#xi, #xa}, {#yi, #ya}},
         GridLines -> {Range[#xi, #xa, #fx], Range[#yi, #ya, #fy]},
         AspectRatio -> #ar, Axes -> #axes,
         Ticks -> {Range[#xi, #xa, #xt], Range[#yi, #ya, #yt]}]} &]
That's all I wanted for the main graph body so... onto visuals:
Adding colours and styles to vertical and horizontal lines as well as axes colour with GridLinesStyle , Background, & AxesStyle
Stand-in colours/styles are placed for now:
  square = FormPage[{"xi" -> <|"Interpreter" -> "Real",
        "Label" -> "x-min value:", "Input" -> -5|>,
      "xa" -> <|"Interpreter" -> "Real", "Label" -> "x-max value:",
        "Input" -> 5|>,
      "yi" -> <|"Interpreter" -> "Real", "Label" -> "y-min value:",
        "Input" -> -5|>,
      "ya" -> <|"Interpreter" -> "Real", "Label" -> "y-max value:",
        "Input" -> 5|>,
      "xt" -> <|"Interpreter" -> "Real",
        "Label" -> "x-axis tick frequency:", "Input" -> 1|>,
      "yt" -> <|"Interpreter" -> "Real",
        "Label" -> "y-axis tick frequency:", "Input" -> 1|>,
      "fx" -> <|"Interpreter" -> "Real",
        "Label" -> "x-axis gridline frequency:", "Input" -> 1|>,
      "fy" -> <|"Interpreter" -> "Real",
        "Label" -> "y-axis gridline frequency:", "Input" -> 1|>,
      "axes" -> {True, False},
      "ar" -> <|"Interpreter" -> "Real",
        "Label" -> "overall aspect ratio:", "Input" -> 1|>}, {graph =
        Graphics[{}, PlotRange -> {{#xi, #xa}, {#yi, #ya}},
         GridLines -> {Range[#xi, #xa, #fx], Range[#yi, #ya, #fy]},
         AspectRatio -> #ar, Axes -> #axes,
         Ticks -> {Range[#xi, #xa, #xt], Range[#yi, #ya, #yt]},
         GridLinesStyle -> {Directive[Red, Dashed],
           Directive[Blue, Dotted]}, Background -> White,
         AxesStyle -> Green]} &]
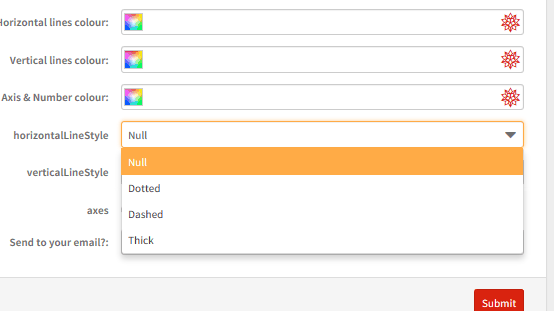
To allow user input ("Null" means regular line); again, with default settings:
   square = FormPage[{"xi" -> <|"Interpreter" -> "Real",
        "Label" -> "x-min value:", "Input" -> -5|>,
      "xa" -> <|"Interpreter" -> "Real", "Label" -> "x-max value:",
        "Input" -> 5|>,
      "yi" -> <|"Interpreter" -> "Real", "Label" -> "y-min value:",
        "Input" -> -5|>,
      "ya" -> <|"Interpreter" -> "Real", "Label" -> "y-max value:",
        "Input" -> 5|>,
      "xt" -> <|"Interpreter" -> "Real",
        "Label" -> "x-axis tick frequency:", "Input" -> 1|>,
      "yt" -> <|"Interpreter" -> "Real",
        "Label" -> "y-axis tick frequency:", "Input" -> 1|>,
      "fx" -> <|"Interpreter" -> "Real",
        "Label" -> "x-axis gridline frequency:", "Input" -> 1|>,
      "fy" -> <|"Interpreter" -> "Real",
        "Label" -> "y-axis gridline frequency:", "Input" -> 1|>,
      "axes" -> {True, False},
      "ar" -> <|"Interpreter" -> "Real",
        "Label" -> "overall aspect ratio:", "Input" -> 1|>,
      "c1" -> <|"Interpreter" -> "Color",
        "Label" -> "Horizontal lines colour:", "Default" -> Black|>,
      "c2" -> <|"Interpreter" -> "Color",
        "Label" -> "Vertical lines colour:", "Default" -> Black|>,
      "c3" -> <|"Interpreter" -> "Color",
        "Label" -> "Axis & Number colour:", "Default" -> Black|>,
        "horizontalLineStyle" -> {"Null" -> Null, "Dotted" -> Dotted,
        "Dashed" -> Dashed, "Thick" -> Thick},
      "verticalLineStyle" -> {"Null" -> Null, "Dotted" -> Dotted,
        "Dashed" -> Dashed, "Thick" -> Thick}}, {graph =
        Graphics[{}, PlotRange -> {{#xi, #xa}, {#yi, #ya}},
         GridLines -> {Range[#xi, #xa, #fx], Range[#yi, #ya, #fy]},
         AspectRatio -> #ar, Axes -> #axes,
         Ticks -> {Range[#xi, #xa, #xt], Range[#yi, #ya, #yt]},
         GridLinesStyle -> {Directive[#c2, #verticalLineStyle],
           Directive[#c1, #horizontalLineStyle]}, Background -> White,
         AxesStyle -> #c3]} &]
Polar Plot
Similar style to that of the coordinate grid replacing Plot with PolarPlot. On the other hand, made PolarGridLines with and alternating colors/styles option.
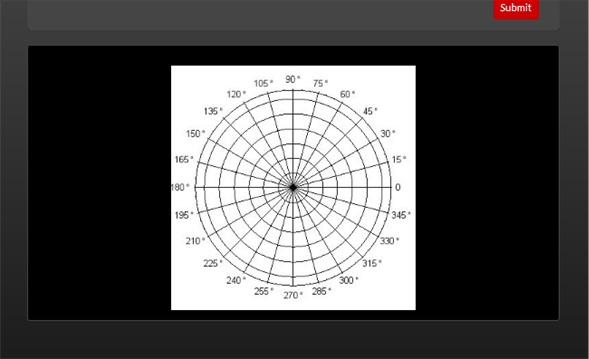
Here, the radius (number of circles) is 5 and pi is divided into 6 sections each. Also made the plot with Opacity zero in order to hide the plot and keep the grid. Named the plot "cgraph"
cgraph = PolarPlot[{2*(5 + 1)/3}, {t, 0, 2 Pi},
  PlotStyle -> Opacity[0],
  PolarGridLines -> {Drop[Table[i, {i, 0, 2 Pi, Pi/6}], -1],
    Block[{j = 0},
     Table[j++;
      If[EvenQ[j], {i, {Null}}, {i, {Null}}], {i,
       5}]]}]
Adding a PolarAxes and PolarTicks:
cgraph = PolarPlot[{2*(5 + 1)/3}, {t, 0, 2 Pi},
  PolarAxes -> Automatic, PlotStyle -> Opacity[0],
  PolarTicks -> {"Degrees", Automatic}, ,
  PolarGridLines -> {Drop[Table[i, {i, 0, 2 Pi, Pi/6}], -1],
    Block[{j = 0},
     Table[j++;
      If[EvenQ[j], {i, {Purple, Dashed}}, {i, {Green, Dotted}}], {i,
       5}]]}]
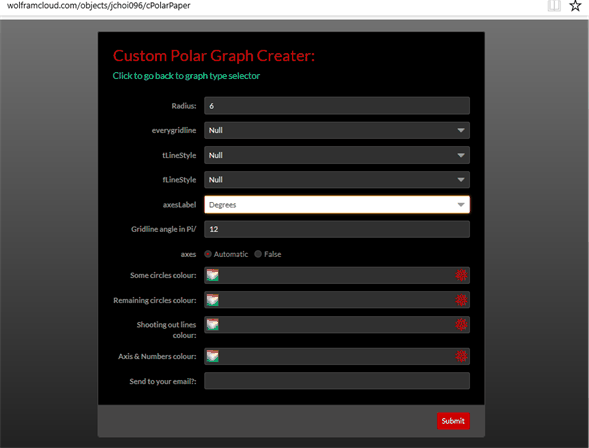
Then finishing with visuals and user input, like for the coordinate grid, and called "circleya":
circleya =
 FormPage[{"r" -> <|"Interpreter" -> "Real", "Label" -> "Radius: ",
     "Input" -> 6|>,
   "everygridline" -> {"Null" -> Null, "Dotted" -> Dotted,
     "Dashed" -> Dashed, "Thick" -> Thick},
   "tLineStyle" -> {"Null" -> Null, "Dotted" -> Dotted,
     "Dashed" -> Dashed, "Thick" -> Thick},
   "fLineStyle" -> {"Null" -> Null, "Dotted" -> Dotted,
     "Dashed" -> Dashed, "Thick" -> Thick},
   "axesLabel" -> {"Degrees", "Radians"},
   "a" -> <|"Interpreter" -> "Integer",
     "Label" -> "Gridline angle in  Pi/", "Input" -> 12|>,
   "axes" -> {Automatic, False},
   "s" -> <|"Interpreter" -> "Integer", "Label" -> "Tick label size",
     "Input" -> 10|>, ,
   "c1" -> <|"Interpreter" -> "Color",
     "Label" -> "Some circles colour:", "Default" -> Black|>,
   "c2" -> <|"Interpreter" -> "Color",
     "Label" -> "Remaining circles colour:", "Default" -> Black|>,
   "c3" -> <|"Interpreter" -> "Color",
     "Label" -> "Shooting out lines colour:", "Default" -> Black|>,
   "c4" -> <|"Interpreter" -> "Color",
     "Label" -> "Axis & Numbers colour:", "Default" -> Black|>},
  {cgraph =
     PolarPlot[{2*(#r + 1)/3}, {t, 0, 2 Pi}, PolarAxes -> #axes,
      Background -> None, PlotStyle -> Opacity[0], PolarTicks -> {#axesLabel, Automatic},
      TicksStyle -> Directive[#c4, #s],
      PolarGridLines -> {Drop[Table[i, {i, 0, 2 Pi, Pi/#a}], -1],
        Block[{j = 0},
         Table[j++;
          If[EvenQ[
            j], {i, {#c1, #tLineStyle}}, {i, {#c2, #fLineStyle}}], \
{i, #r}]]}, Axes -> False,
      GridLinesStyle -> {#c3, #everygridline}]} &]
Adding Email Input Option:
Adding "sendEmail" -> <|"Interpreter" -> "EmailAddress", "Label" -> "Send to your email?:", "Required" -> False |> to the formspec (first argument),
and (Module[{func},If[Not[MissingQ[#sendEmail]], SendMail[<|"To" -> #sendEmail, "Subject" -> "YOUR GRAPH PAPER YAY!", "Body" -> Rasterize[cgraph]|>]]; cgraph])]& to the next:
Coordinate:
square = FormPage[{"xi" -> <|"Interpreter" -> "Real",
     "Label" -> "x-min value:", "Input" -> -5|>,
   "xa" -> <|"Interpreter" -> "Real", "Label" -> "x-max value:",
     "Input" -> 5|>,
   "yi" -> <|"Interpreter" -> "Real", "Label" -> "y-min value:",
     "Input" -> -5|>,
   "ya" -> <|"Interpreter" -> "Real", "Label" -> "y-max value:",
     "Input" -> 5|>,
   "xt" -> <|"Interpreter" -> "Real",
     "Label" -> "x-axis tick frequency:", "Input" -> 1|>,
   "yt" -> <|"Interpreter" -> "Real",
     "Label" -> "y-axis tick frequency:", "Input" -> 1|>,
   "fx" -> <|"Interpreter" -> "Real",
     "Label" -> "x-axis gridline frequency:", "Input" -> 1|>,
   "fy" -> <|"Interpreter" -> "Real",
     "Label" -> "y-axis gridline frequency:", "Input" -> 1|>,
   "axes" -> {True, False},
   "ar" -> <|"Interpreter" -> "Real",
     "Label" -> "overall aspect ratio:", "Input" -> 1|>,
   "c1" -> <|"Interpreter" -> "Color",
     "Label" -> "Horizontal lines colour:", "Default" -> Black|>,
   "c2" -> <|"Interpreter" -> "Color",
     "Label" -> "Vertical lines colour:", "Default" -> Black|>,
   "c3" -> <|"Interpreter" -> "Color",
     "Label" -> "Axis & Number colour:", "Default" -> Black|>,
   "horizontalLineStyle" -> {"Null" -> Null, "Dotted" -> Dotted,
     "Dashed" -> Dashed, "Thick" -> Thick},
   "verticalLineStyle" -> {"Null" -> Null, "Dotted" -> Dotted,
     "Dashed" -> Dashed, "Thick" -> Thick},
   "sendEmail" -> <|"Interpreter" -> "EmailAddress",
     "Label" -> "Send to your email?:", "Required" -> False |>},
  Module[{graph =
      Graphics[{}, PlotRange -> {{#xi, #xa}, {#yi, #ya}},
       GridLines -> {Range[#xi, #xa, #fx], Range[#yi, #ya, #fy]},
       AspectRatio -> #ar, Axes -> #axes,
       Ticks -> {Range[#xi, #xa, #xt], Range[#yi, #ya, #yt]},
       GridLinesStyle -> {Directive[#c2, #verticalLineStyle],
         Directive[#c1, #horizontalLineStyle]}, Background -> White,
       AxesStyle -> #c3]},
    If[Not[MissingQ[#sendEmail]],
     SendMail[<|"To" -> #sendEmail,
        "Subject" -> "YOUR GRAPH PAPER YAY!",
        "Body" -> Rasterize[graph]|>] &]; graph] &]
Did same for Polar. Final graph codes will be shown somewhere below.
Now onto creating a website with CloudDeploy
Created a page for each graph type:
cdSquare =
 CloudDeploy[square, CloudObject["user:jchoi096/sgraphPaper"]]
cdCircleYa =
 CloudDeploy[circleya, CloudObject["user:jchoi096/cPolarPaper"]]
Now, I wanted to add titles to the graph pages (at end of each graph code):
AppearanceRules -> <|"Title" -> "Custom Coordinate Grid Creater:",
and
AppearanceRules -> <|"Title" -> "Custom Polar Graph Creater:",
Additionally, I wanted to slightly change the appearances of the pages to distinguish between them better, such as:
PageTheme -> "Black"
Or Red, or White
.
Finally,
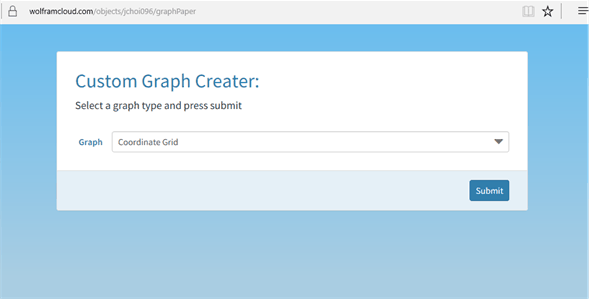
Created a separate main graph selection page:
typeChooser =
  FormFunction[{"Graph" -> {"Coordinate Grid", "Polar"}},
   Switch[#Graph, "Polar", HTTPRedirect[cdCircleYa],
     "Coordinate Grid", HTTPRedirect[cdSquare]] &,
   AppearanceRules -> <|"Title" -> "Custom Graph Creater:",
     "Description" -> "Select a graph type and press submit"|>,
   PageTheme -> "Blue"];
CloudDeploy[typeChooser, CloudObject["user:jchoi096/graphPaper"]]
I wanted to be able to go back to the main page from the graph pages so a Hyperlink was added to finish off each graph code:
"Description" ->
  Hyperlink["Click to go back to graph type selector",
   "https://www.wolframcloud.com/objects/jchoi096/graphPaper"]|>,
Final code for graphs:
Coordinate:
square = FormPage[{"xi" -> <|"Interpreter" -> "Real",
     "Label" -> "x-min value:", "Input" -> -5|>,
   "xa" -> <|"Interpreter" -> "Real", "Label" -> "x-max value:",
     "Input" -> 5|>,
   "yi" -> <|"Interpreter" -> "Real", "Label" -> "y-min value:",
     "Input" -> -5|>,
   "ya" -> <|"Interpreter" -> "Real", "Label" -> "y-max value:",
     "Input" -> 5|>,
   "xt" -> <|"Interpreter" -> "Real",
     "Label" -> "x-axis tick frequency:", "Input" -> 1|>,
   "yt" -> <|"Interpreter" -> "Real",
     "Label" -> "y-axis tick frequency:", "Input" -> 1|>,
   "fx" -> <|"Interpreter" -> "Real",
     "Label" -> "x-axis gridline frequency:", "Input" -> 1|>,
   "fy" -> <|"Interpreter" -> "Real",
     "Label" -> "y-axis gridline frequency:", "Input" -> 1|>,
   "axes" -> {True, False},
   "ar" -> <|"Interpreter" -> "Real",
     "Label" -> "overall aspect ratio:", "Input" -> 1|>,
   "c1" -> <|"Interpreter" -> "Color",
     "Label" -> "Horizontal lines colour:", "Default" -> Black|>,
   "c2" -> <|"Interpreter" -> "Color",
     "Label" -> "Vertical lines colour:", "Default" -> Black|>,
   "c3" -> <|"Interpreter" -> "Color",
     "Label" -> "Axis & Number colour:", "Default" -> Black|>,
   "horizontalLineStyle" -> {"Null" -> Null, "Dotted" -> Dotted,
     "Dashed" -> Dashed, "Thick" -> Thick},
   "verticalLineStyle" -> {"Null" -> Null, "Dotted" -> Dotted,
     "Dashed" -> Dashed, "Thick" -> Thick},
   "sendEmail" -> <|"Interpreter" -> "EmailAddress",
     "Label" -> "Send to your email?:", "Required" -> False|>},
  Module[{graph =
      Graphics[{}, PlotRange -> {{#xi, #xa}, {#yi, #ya}},
       GridLines -> {Range[#xi, #xa, #fx], Range[#yi, #ya, #fy]},
       AspectRatio -> #ar, Axes -> #axes,
       Ticks -> {Range[#xi, #xa, #xt], Range[#yi, #ya, #yt]},
       GridLinesStyle -> {Directive[#c2, #verticalLineStyle],
         Directive[#c1, #horizontalLineStyle]}, Background -> White,
       AxesStyle -> #c3]},
    If[Not[MissingQ[#sendEmail]],
     SendMail[<|"To" -> #sendEmail,
        "Subject" -> "YOUR GRAPH PAPER YAY!",
        "Body" -> Rasterize[graph]|>] &]; graph] &,
  AppearanceRules -> <|"Title" -> "Custom Coordinate Grid Creater:",
    "Description" ->
     Hyperlink["Click to go back to graph type selector",
      "https://www.wolframcloud.com/objects/jchoi096/graphPaper"]|>,
  PageTheme -> "White"]
Polar:
circleya =
 FormPage[{"r" -> <|"Interpreter" -> "Real", "Label" -> "Radius: ",
     "Input" -> 6|>,
   "everygridline" -> {"Null" -> Null, "Dotted" -> Dotted,
     "Dashed" -> Dashed, "Thick" -> Thick},
   "tLineStyle" -> {"Null" -> Null, "Dotted" -> Dotted,
     "Dashed" -> Dashed, "Thick" -> Thick},
   "fLineStyle" -> {"Null" -> Null, "Dotted" -> Dotted,
     "Dashed" -> Dashed, "Thick" -> Thick},
   "axesLabel" -> {"Degrees", "Radians"},
   "a" -> <|"Interpreter" -> "Integer",
     "Label" -> "Gridline angle in  Pi/", "Input" -> 12|>,
   "axes" -> {Automatic, False},
   "s" -> <|"Interpreter" -> "Integer", "Label" -> "Tick label size",
     "Input" -> 10|>, ,
   "c1" -> <|"Interpreter" -> "Color",
     "Label" -> "Some circles colour:", "Default" -> Black|>,
   "c2" -> <|"Interpreter" -> "Color",
     "Label" -> "Remaining circles colour:", "Default" -> Black|>,
   "c3" -> <|"Interpreter" -> "Color",
     "Label" -> "Shooting out lines colour:", "Default" -> Black|>,
   "c4" -> <|"Interpreter" -> "Color",
     "Label" -> "Axis & Numbers colour:", "Default" -> Black|>,
   "sendEmail" -> <|"Interpreter" -> "EmailAddress",
     "Label" -> "Send to your email?:",
     "Required" ->
      False |>}, (Module[{cgraph =
       PolarPlot[{2*(#r + 1)/3}, {t, 0, 2 Pi}, PolarAxes -> #axes,
        Background -> None, PlotStyle -> Opacity[0],
        PolarTicks -> {#axesLabel, Automatic},
        TicksStyle -> Directive[#c4, #s],
        PolarGridLines -> {Drop[Table[i, {i, 0, 2 Pi, Pi/#a}], -1],
          Block[{j = 0}, Table[j++;

            If[EvenQ[
              j], {i, {#c1, #tLineStyle}}, {i, {#c2, #fLineStyle}}], \
{i, #r}]]}, Axes -> False, GridLinesStyle -> {#c3, #everygridline}]},
     If[Not[MissingQ[#sendEmail]],
      SendMail[<|"To" -> #sendEmail,
        "Subject" -> "YOUR GRAPH PAPER YAY!",
        "Body" -> Rasterize[cgraph]|>]]; cgraph]) &,
  AppearanceRules -> <|"Title" -> "Custom Polar Graph Creater:",
    "Description" ->
     Hyperlink["Click to go back to graph type selector",
      "https://www.wolframcloud.com/objects/jchoi096/graphPaper"]|>,
  PageTheme -> "Black"]
Website End Results and Outputs
Directory Page:
Coordinate:
Polar:

Here's a link to the directory page (is probably not accessible though :| ) : https://www.wolframcloud.com/objects/jchoi096/graphPaper
If I went further?
Would add more graph types to select from.
Additionally, the code was created with the big help of mentor Andrea.