By running the lines of the program below you can see looking at the front view that all the numbers contained inside the graph colored are the analogical representation of the numbers within the graphic.
n1=RandomInteger[{-400,400},{100}]
n=Sort[n1]
n3=RandomInteger[{-400,400},{100}]
n2=Sort[n3]
x2=n2*(n2-Power[n2, (n2)^-1])
y2=n2-n2*Power[n2, (n2)^-1]
z2=x/y
w2=z^n
x=n*(n-Power[n, (n)^-1])
y=n-n*Power[n, (n)^-1]
z=x/y
w=z^n
g=(y*y2)/y
f=(y*y2)/y2
g2=(x*x2)/x
f2=(x*x2)/x2
g2f2=(g2-f2)/(f-g)
gh=ListPlot[{g2f2,g2,f2}]
ListPolarPlot[{g2f2},{g2},{f2}]
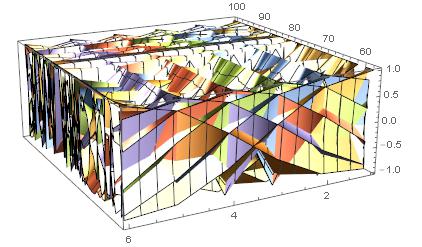
data=Table[Cos[(g2-f2)/(f-g)],{g2,0,Pi,Pi/5},{f2,0,Pi,Pi/5}]
ListPlot3D[data,InterpolationOrder->3, ColorFunction->{g2f2->Yellow,g2->Blue,f2->Green}]