Message Boards Message Boards

[?] CountourPlot of (Cos(2x))^2 ==0 ?

Posted 7 years ago

Hello,

I am trying to plot the countour curve of (cos(2x))^2 ==0 on the xy-plane for {x, -pi/2, pi/2} and {y,0,2pi}, but the results is an empty plot in mathemaitca. However, I obtained the correct plot for cos(2x)==0.

I used the following command lines:

ContourPlot[Cos[2x]^2 ==0, {x, -Pi/2, Pi/2}, {y, 0, 2Pi}]

How can I get the correct graph for this?

Thank you,

Bhagya

POSTED BY: Bhagya Athu
7 Replies

There are curious discretization artifacts:

ContourPlot[x^2 == 1/10000, {x, -1, 1}, {y, -1, 1}, 
 PlotRange -> {{.0022, .01}, {-.3, .3}}]
ContourPlot[10000 x^2 == 1, {x, -1, 1}, {y, -1, 1}, 
 PlotRange -> {{.0022, .01}, {-.3, .3}}]

Also, in the current Mathematica version the tooltip looks like a job left incomplete.

POSTED BY: Gianluca Gorni

Really curious... You are right!

And one more additional curiosity:

ContourPlot[x^2 == 1/10000, {x, -1, 1}, {y, -1, 1}, PlotRange -> {{.0022, .01}, {-.3, .3}}, PlotPoints -> 30]
ContourPlot[10000 x^2 == 1, {x, -1, 1}, {y, -1, 1}, PlotRange -> {{.0022, .01}, {-.3, .3}}, PlotPoints -> 30]

enter image description here

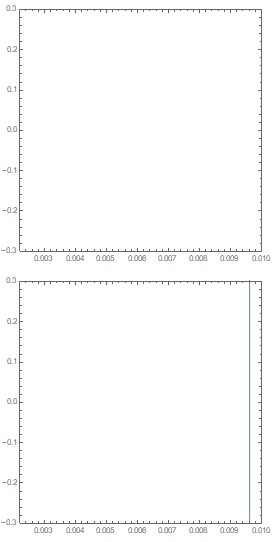
Why are not identical the results?

Apropos, dear Gianluca,

How to interpret the following?

ContourPlot[x^2 == .0001, {x, -1, 1}, {y, -1, 1}]

enter image description here

ContourPlot[x^2 == .0001, {x, -1, 1}, {y, -1, 1}, PlotRange -> All]

enter image description here

POSTED BY: Gianluca Gorni

The numerical algorithms of ContourPlot assume nonzero derivative, or transversality, otherwise they may fail spectacularly:

ContourPlot[x^2 == 0, {x, -1, 1}, {y, 0, 1}]

In your case you get a correct plot by symbolic pre-processing:

ContourPlot[
 Evaluate[List @@ 
   Reduce[Cos[2*x]^2 == 0 && -Pi/2 < x < Pi/2, x, Reals]],
 {x, -Pi/2, Pi/2}, {y, 0, 2 Pi}]
POSTED BY: Gianluca Gorni

Apropos, dear Gianluca,

How to interpret the following?

ContourPlot[x^2 == .0001, {x, -1, 1}, {y, -1, 1}]

enter image description here

ContourPlot[x^2 == .0001, {x, -1, 1}, {y, -1, 1}, PlotRange -> All]

enter image description here

It's interesting that the graph may be obtain if the right part is not exactly $0$:

ContourPlot[
 Cos[2 x]^2 == 0.000000000000000001, {x, -\[Pi]/2, \[Pi]/2}, {y, 0, 
  2 \[Pi]}]

enter image description here

Reply to this discussion
Community posts can be styled and formatted using the Markdown syntax.
Reply Preview
Attachments
Remove
or Discard

Group Abstract Group Abstract