Hello, Community!
A problem - simple command:
ContourPlot[ 216 + 1728 b1 + 5184 b1^2 + 6912 b1^3 + 3456 b1^4 - 108 b2 - 648 b1 b2 - 1296 b1^2 b2 - 864 b1^3 b2 - 32 b2^2 - 128 b1 b2^2 -
   128 b1^2 b2^2 + 12 b2^3 + 24 b1 b2^3 + 3 b2^4 == 0, {b2, -0.001,  0.001}, {b1, -0.5001, -0.4999}]
draws smthng strange (impossible for any polynom!) 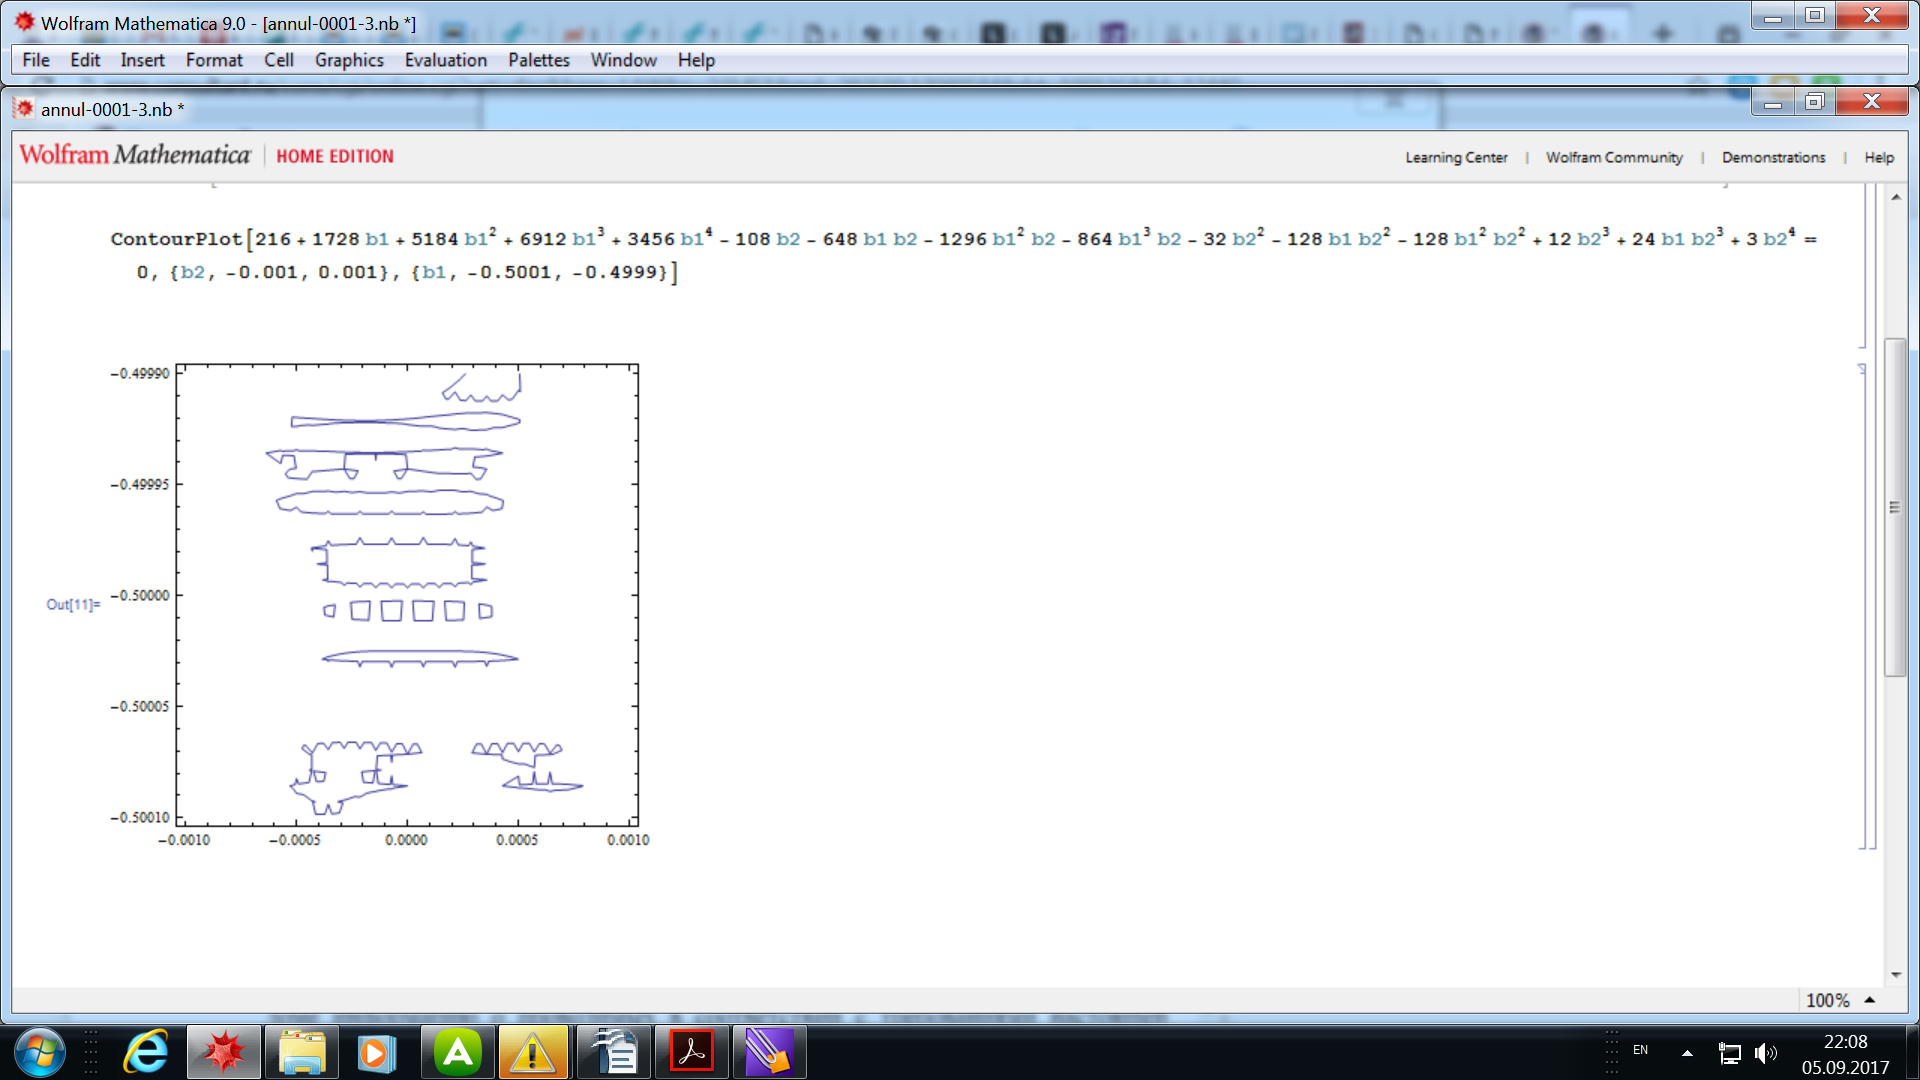
There is a problem with limits of a picture - when i take another limits, picture is as i wait to see - 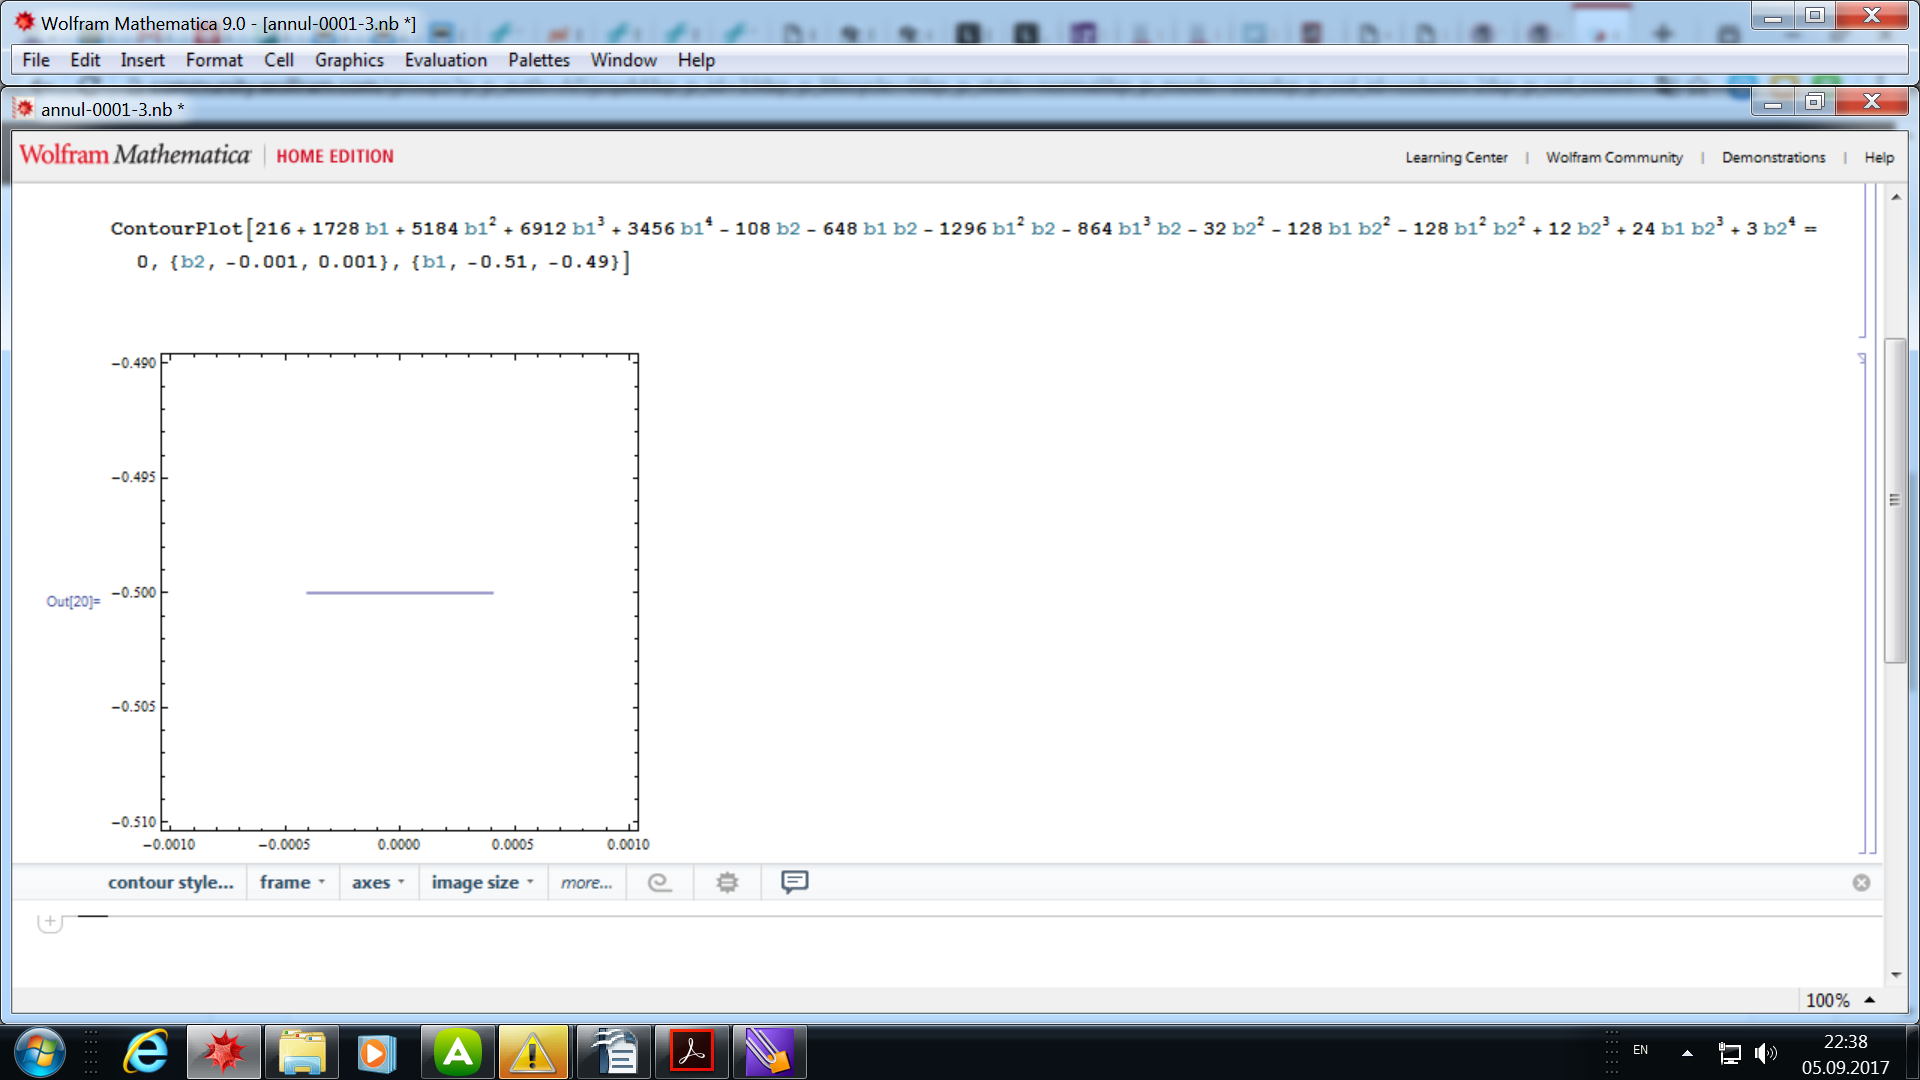
So, the question - it's a problem of: program / (noname) comp / ContourPlot?
UPD: When i use Manipulate - picture becomes more interesting:
Manipulate[ ContourPlot[ 216 + 1728 b1 + 5184 b1^2 + 6912 b1^3 + 3456 b1^4 - 108 b2 - 648 b1 b2 - 1296 b1^2 b2 - 864 b1^3 b2 - 32 b2^2 - 128 b1 b2^2 - 128 b1^2 b2^2 + 12 b2^3 + 24 b1 b2^3 + 3 b2^4 == 0, {b2, -0.001, 0.001}, {b1, -0.5 - k, -0.5 + k}], {k, 0.00001, 0.01}]
With big k - we see a straight line segment, with smaller - nothing, and with smallest - fantastic pics with no relation to given equation.


