Message Boards Message Boards

1
|
9086 Views
|
7 Replies
|
5 Total Likes
View groups...
Share
Share this post:

Use FindPeaks in a DateListPlot?

Posted 7 years ago

Hi All,

A very simple question but I can't find why 'FindPeaks' are not working in DateListPlot. What is wrong?

Thanks in advance !

fakedata = {{{2015, 3, 25}, 130}, {{2015, 3, 26}, 
    132}, {{2015, 3, 27}, 132}, {{2015, 3, 30}, 133}, {{2015, 3, 31}, 
    132}, {{2015, 4, 1}, 131}, {{2015, 4, 2}, 131}, {{2015, 4, 3}, 
    131}, {{2015, 4, 6}, 131}, {{2015, 4, 7}, 131}, {{2015, 4, 8}, 
    129}, {{2015, 4, 9}, 132}, {{2015, 4, 10}, 133}, {{2015, 4, 13}, 
    132}, {{2015, 4, 14}, 131}, {{2015, 4, 15}, 131}, {{2015, 4, 16}, 
    128}, {{2015, 4, 17}, 125}, {{2015, 4, 20}, 127}, {{2015, 4, 21}, 
    127}};

peaks = FindPeaks[Take[fakedata[[All, 2]]]]

DateListPlot[
 fakedata
 , PlotRange -> {Automatic, {123, 135}}
 , Epilog -> {Red, PointSize[0.02], Point[peaks]}
 ]

enter image description here

POSTED BY: Jos Klaps
7 Replies

Dear Chris,

Thanks for your reply, tip and help !

Best Regards,....Jos

POSTED BY: Jos Klaps

Dear All,

Thanks again for your reply and interest.

@Chris P, very interested and usefull information. Thanks.

For your information only: The calculated 'FindPeaks' and 'Dates' at the top only (x-axis 2).

fakedata = {{{2015, 3, 25}, 130}, {{2015, 3, 26}, 
    132}, {{2015, 3, 27}, 132}, {{2015, 3, 30}, 133}, {{2015, 3, 31}, 
    132}, {{2015, 4, 1}, 131}, {{2015, 4, 2}, 131}, {{2015, 4, 3}, 
    131}, {{2015, 4, 6}, 131}, {{2015, 4, 7}, 131}, {{2015, 4, 8}, 
    129}, {{2015, 4, 9}, 132}, {{2015, 4, 10}, 133}, {{2015, 4, 13}, 
    132}, {{2015, 4, 14}, 131}, {{2015, 4, 15}, 131}, {{2015, 4, 16}, 
    128}, {{2015, 4, 17}, 125}, {{2015, 4, 20}, 127}, {{2015, 4, 21}, 
    127}};

data = Take[fakedata[[All, 2]]];

peaks = FindPeaks[data]

ListLinePlot[
 data
 , PlotRange -> {Automatic, {123, 135}}
 , Epilog -> {Red, PointSize[0.02], Point[peaks]}
 , GridLines -> Automatic
 , Frame -> True
 , FrameTicks -> {{True, 
    None}, {True, {{4, "30 Mar\n2015"}, {13, "10 Apr \n2015"}, {19.5, 
      "20 Apr\n2015"}}}}
 ]

enter image description here

Regards,....Jos

POSTED BY: Jos Klaps
Posted 7 years ago

You have to be very careful here with this approach, one might think that the time scale is linear here which is not, because your data are not regularly sampled. For example, as you can see the distances (30th of March - 10th of April) and (10th of April - 20th of April) which actually correspond both to 10 days, do not appear the same in the graphic !

But your approach will work very well as soon as you have data for each day !

Regards,

Chris

POSTED BY: Chris P
Posted 7 years ago

Interesting problem. I've never used FindPeaks before and thought that you just could feed it with any arbitrary 2D set of points and get back directly the 2D coordinates of the peak.

The problem seems to be that FindPeaks can only deal with regularly sampled data.

1. Values Method

That is why, one possible input for FindPeaks is simply a sequence of 1D values (with their positions playing the role of abscissa). In your example, you correctly give as input only the sequence of the ordinates and get the relative positions of the peaks:

peaks = FindPeaks[fakedata[[All, 2]]]

{{4, 133}, {13, 133}, {39/2, 127}}

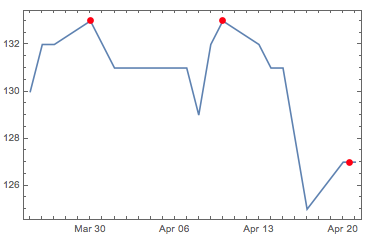
Two peaks (with value 133) are detected in the 4th and 13th positions of the sequence corresponding respectively to the dates {2015,3,30} and {2015,4,10}. The last peak (value 127) is most interesting as it is located at position 39/2=19.5, between position 19 and 20 of your input list : in the fakedata list that would correspond to the 20th of April 2015 at noon !

Then, the main problem is how to convert back these positions (4,13,39/2) into their real abscissas (which in addition here are time entities !). The solution was already given above (by Sander Huisman), and consists in directly interpolating the abscissas.

ip = Interpolation[AbsoluteTime /@ fakedata[[All, 1]], InterpolationOrder -> 1];

By default, the interpolation order is 3, so it is better to make it explicitly linear here.

You can for example then check that 39/2 corresponds indeed to the 20th of April at noon:

ip[39/2] // DateObject

image

Then:

ipeaks = MapAt[ip, peaks, {All, 1}];
DateListPlot[fakedata,  Epilog -> {Red, PointSize[0.02], Point[ipeaks]}]

enter image description here

2. TimeSeries method

The documentation says also that FindPeaks can input regularly sampled time series, which is not the case with your data

RegularlySampledQ@fakedata

False

but we can convert and resample:

fakedataseries = 
  TimeSeries[fakedata] // 
   TimeSeriesResample[#, Join[#["Dates"][[{1, -1}]], {"Day"}], 
     ResamplingMethod -> {"Interpolation", InterpolationOrder -> 1}] &;

You now have a regularly sampled time series which you can directly (2D coordinates) feed in FindPeaks and get the final peaks:

RegularlySampledQ@fakedataseries

True

speaks = FindPeaks[fakedataseries]["DatePath"]

enter image description here

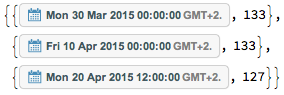
DateListPlot[fakedata, Epilog -> {Red, PointSize[0.02], Point[speaks]}]

enter image description here

3. PeakDetect

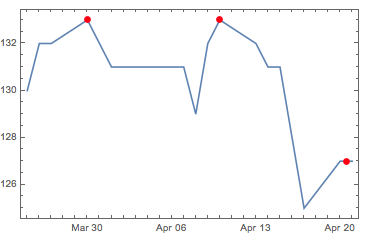
Finally, you can have a look at the function PeakDetect which seems to work almost as FindPeaks but does not interpolate the positions of the peaks and makes it possible to retrieve directly all of them:

dpeaks = Pick[fakedata, PeakDetect[fakedata[[All, 2]]], 1];
DateListPlot[fakedata, Epilog -> {Red, PointSize[0.02], Point[dpeaks]}]

enter image description here

However, note now the last two peaks instead of one interpolated peak with FindPeaks.


Anyway, it would be nice if FindPeaks could take care of these problems directly, maybe in some future version.

POSTED BY: Chris P

Dear Kapio and Sander,

Thanks for your reply and help.

@Sander, your proposal works perfect. Thanks again.

Please, one more question: do you know how the peaks (by slope?) are calculated. Where can I find the equations in MM?

Regards,....Jos

POSTED BY: Jos Klaps

You have to do some tricks to get it to work with dates:

fakedata = {{{2015, 3, 25}, 130}, {{2015, 3, 26}, 
    132}, {{2015, 3, 27}, 132}, {{2015, 3, 30}, 133}, {{2015, 3, 31}, 
    132}, {{2015, 4, 1}, 131}, {{2015, 4, 2}, 131}, {{2015, 4, 3}, 
    131}, {{2015, 4, 6}, 131}, {{2015, 4, 7}, 131}, {{2015, 4, 8}, 
    129}, {{2015, 4, 9}, 132}, {{2015, 4, 10}, 133}, {{2015, 4, 13}, 
    132}, {{2015, 4, 14}, 131}, {{2015, 4, 15}, 131}, {{2015, 4, 16}, 
    128}, {{2015, 4, 17}, 125}, {{2015, 4, 20}, 127}, {{2015, 4, 21}, 
    127}};
fakedata[[All, 1]] = AbsoluteTime /@ fakedata[[All, 1]];
if = Interpolation[fakedata[[All, 1]]]

peaks = FindPeaks[fakedata[[All, 2]]]
peaks = {if[#1], #2} & @@@ peaks;
DateListPlot[fakedata, PlotRange -> {Automatic, {123, 135}}, 
 Epilog -> {Red, PointSize[0.02], Point[peaks]}]
POSTED BY: Sander Huisman

Why do you have Take there that does nothing? Well, anyway, you are using DateListPlot which take dates for x-axis. But then you use points in Epilog that have some none-date coordinates? Of course they won't show your plot. You need to extract dates corresponding to those peaks and use them as x-coordinates for your point.

POSTED BY: Kapio Letto
Reply to this discussion
Community posts can be styled and formatted using the Markdown syntax.
Reply Preview
Attachments
Remove
or Discard

Group Abstract Group Abstract