Message Boards Message Boards

[?] High resolution GeoElevationData ?

Posted 7 years ago

I'm trying to produce 3D models in the Wolfram Language of various mountains around the world. The GeoElevationData[] function does not have enough resolution for a good looking model at the scale of a mountain, so I'm searching for online data sets that have more resolution and can be imported into Wolfram. For mountains in the United States, the United States Geological Survey offers ArcGRID files that Wolfram can import. This has worked fabulously, producing models such as this:

enter image description here

(Can you tell what mountain it is?)

But when I try to find data for mountains outside the US, like Mt. Fuji or Mt. Everest, I get overwhelmed by the abundance of file formats that, as far as I can tell, won't work in Wolfram. I sense that there is a way to do this. Has anyone solved this problem before? I could sure use some help here.

Thanks in advance,

Mark Greenberg

POSTED BY: Mark Greenberg
18 Replies

Sorry, I come late to the party.

My aim is to generate a disk representation of mountains for 3D printing. I would like to use ListPlot3D, not the "Region" option of GeoElevationData for generating a disk. That way, I think I have more options for customization. I found the option "RegionFunction" for ListPlot3D but don't get it to work.

It would be good if the radius of the disk could be set in metric [km] units.

Sorry, I don't have access to Mathematica at the moment. I will post my code as a longer post once it is finished. I am thankful for any ideas!

Perhaps this can add to the discussion: Exploring Lunar Geography with GeoElevationData

POSTED BY: Vitaliy Kaurov

Please, note that due to the standard difference between the {i, j} indexing of matrices and the {x, y} Cartesian coordinates, ListPlot3D does not plot the result of GeoElevationData with the correct orientation. Use of Reverse is needed.

For example, compare the results of this input with an without the use of Reverse:

ListPlot3D[Reverse@GeoElevationData["World"], PlotRange -> {0, All}]

enter image description here

Posted 7 years ago

Ah, yes. The difference turns out to be an update to Mathematica. In version 11.0.1, GeoElevationData[] produced the low-res images I posted above. Now that I have updated to 11.2, the same code results in the models that Marco, Vitaliy, and Emmanuel have posted. Problem solved, though I'm somewhat embarrassed that my laziness in updating Mathematica has wasted my time and yours.

I suppose it is not entirely a waste for me. I learned how to import outside data, in this case the elevation data from USGS, even though it turned out I didn't need to. I also learned a lot about elevation data. Of particular interest is the LiDAR data that Ian posted about. In some parts of Wales the resolution of the data set is 25 cm. At first that sounds like a mistake. How can elevation data points be spaced about the width of a soccer ball? But it is true. If you look at the relief images from the Wales LiDAR data, you can not only see individual buildings, but also the air-conditioner units on top of each building!

Again, thank you all.

Mark Greenberg

P.S. Here are the models I promised of the mountains in the United Kingdom. The first is Ben Nevis and the second is Ben Macdui:

enter image description here enter image description here

POSTED BY: Mark Greenberg

This here is Mount St. Helens just with data from built-in data.

data = GeoElevationData[GeoDisk[Entity["Mountain", "MountSaintHelens"], Quantity[3, "Miles"]], GeoZoomLevel -> 16];
ListPlot3D[data, Mesh -> None, PlotStyle -> RGBColor["#bcdcdd"],(*ColorFunction\[Rule]"LightTerrain",*)
Boxed -> False, Axes -> False, Filling -> Bottom, FillingStyle -> {Blue, Opacity[1]}, ImageSize -> 680]

enter image description here

The resolution is actually higher than it appears on this low-res video.

enter image description here

The rim of the volcano looks a bit different from the one in the OP though.

Here is the same for Mt Fuji.

enter image description here

Best wishes,

Marco

POSTED BY: Marco Thiel

GeoElevationData[] has a good amount of data for plotting 3d views of mountains and volcanoes.

Here is an example for the Popocatépetl volcano located at the center of México. Notice that the x and y axis units were transformed to meters by converting pairs of coordinates to geodesic distances using GeoDistance.

coords = Flatten[
   Table[{lat, lon}, {lat, 18.98, 
     19.07, .0006}, {lon, -98.68, -98.57, .0006}], 1];

elevations = 
  QuantityMagnitude@Normal@GeoElevationData[GeoPosition[coords]];

distances = 
  Map[{QuantityMagnitude@
      UnitConvert[GeoDistance [{18.98, -98.68}, {#[[1]], -98.68}], 
       "Meters"], 
     QuantityMagnitude@
      UnitConvert[GeoDistance [{18.98, -98.68}, {18.98, #[[2]]}], 
       "Meters"]} &, coords];

data = MapThread[Append, {distances, elevations}];

ListPlot3D[data, InterpolationOrder -> 3, Mesh -> None, 
 PlotStyle -> RGBColor["#bcdcdd"], ImageSize -> 1000]

Popocatépetl volcano

POSTED BY: Emmanuel Garces

Folks, GeoElevationData, what resolution is needed? This is a typical example with {254, 286} points. What are you looking for?

enter image description here

ListPlot3D[data, MeshFunctions -> {#3 &}, Mesh -> 20,
 ColorFunction -> "LightTerrain", Boxed -> False]

enter image description here

POSTED BY: Vitaliy Kaurov
Posted 7 years ago

Thanks, Vitaliy. I'm not sure that I'd consider Mt. Everest "typical," especially when giving an example of size, scale, and resolution.

Even so, when I run your code on my machine, I get much different results:

enter image description here

data = GeoElevationData[GeoDisk[Entity["Mountain", "MountEverest"],Quantity[3, "Miles"]]];
ListPlot3D[data, MeshFunctions -> {#3 &}, Mesh -> 20,ColorFunction -> "LightTerrain", Boxed -> False]

enter image description here

The results are even worse for smaller mountains like Mt. Fuji.

enter image description here

Why would you get different results? I'm using Wolfram 11.0.1 on Mac OS X 10.12.6. I'll try updating to the latest version of Wolfram to see whether that makes a difference.

If I could create models of all sized mountains the same quality that you were able to make of Mt. Everest, then I'd have no reason to use outside data sets.

POSTED BY: Mark Greenberg

What happens if you try to control this with GeoZoomLevel -> 16 ?

data = 
GeoElevationData[
    GeoDisk[Entity["Mountain", "MountEverest"], Quantity[3, "Miles"]], 
    GeoZoomLevel -> 16
]
POSTED BY: Vitaliy Kaurov
Posted 7 years ago

I have made a model of Mt. Fuji using the GeoTIFF file format for data downloaded from a site whose data covers the entire earth, the GMTED2010 Viewer, also by the USGS. GeoTIFF is a .tif image file that has elevation data instead of color. It comes into Wolfram as an image, and then I used the following code to turn it into a model.

tDat = Import["/Path/Japan34.tif", {"GeoTIFF","Data"}][[4800 - 3550 ;; 4800 - 3450, 4450 ;; 4550]];
model = ListPlot3D[tDat, PlotStyle -> RGBColor["#bcdcdd"], PlotRange -> {0, 3800}, Mesh -> None, Boxed -> False, 
   Filling -> Bottom, FillingStyle -> {Brown, Opacity[1]},Axes -> {False, False, True}, BoxRatios -> {1, 1, .2},ImageSize -> 480];

The data has a resolution of 7.5 arc seconds, about 225 meters. This is low res for a mountain, so the model doesn't look as good as I'd like:

enter image description here

Cropping the data further makes the mountain look like a nondescript bump. I need a resolution of about 1 arc second for a good looking model.

My purpose for making these models is to show off the shapes of the mountains, so I do not have a need to overlay imagery onto the surface, though this would be a logical next step for a realistic model.

Next I'll see if I can make the LiDar data work for me that Ian mentioned.

POSTED BY: Mark Greenberg

Hi Mark,

Here in the UK, the Environment Agency (England) and Natural Resources Wales (Wales) publish public domain LiDAR data that covers pretty much the entire country. Horizontal grid point spacings range from 25cm to 200cm (depending on location). The data is presented using British National Grid coordinates, but can be converted to longitude and latitude if required.

You can find the data fairly easily using Google, but, as a starter-for-10, you could try the following links:

https://data.gov.uk/dataset/lidar-composite-dsm-1m1/resource/59150aed-6b07-413b-943d-cf7336359cb2http://lle.gov.wales/Catalogue/Item/LidarCompositeDataset/?lang=en

http://lle.gov.wales/Catalogue/Item/LidarCompositeDataset/?lang=en

Whilst the mountains here aren't that high, the data resolution should be good.

Hope this is of use,

Ian

POSTED BY: Ian Williams
Posted 7 years ago

I'll make sure to make a model of a mountain or two from the UK once a solution is found. I was unable to open the first link in your post. The second one for Wales allows viewing and printing of maps, but as far as I can tell the data is not available for download. They use Lidar data, and I've seen that format on other sites too. The formats that Wolfram can handle (from the docs) are ArcGRID, USGSDEM, GTOPO30, CDED, SDTSDEM, and SurferGrid. Also, GeoTIFF, which I'm experimenting with right now. GeoTIFF is tricky, but if I can master it, it covers the whole earth (except the South Pole).

Thanks for the help, Ian.

POSTED BY: Mark Greenberg

Hi Marc,

Have you seen this blog on extracting elevation data from Google?

http://mathgis.blogspot.co.uk/2010/03/extract-elevation-data-with-google.html

I've not tried it, but thought it could be useful so filed the link.

The UK LiDAR data is presented in a very simple text format and can be read into M using the Import function. I had a play with bringing data into M a year or so ago as an alternative to Surfer when I needed to generate ground surface contour maps. It worked well. But have lost, or didn't keep, the notebook. It's not a big job, so will knock up a simple example and ping it over when I have a mo.

Have you thought of draping air imagery over the surface model using the Texture function?

All the best,

Ian

POSTED BY: Ian Williams

Mark,

A few years ago some interns of mine did an elevation project using Google's JavaScript API. Google has elevation data for the entire planet. Coincidentally, Google's example starts with a 3D relief of Denali! You can drag their example map around the globe and zoom in. The documentation is here with an example You can also get elevation data along a path. For your use it seems like it would be free -- they charge a fee for usage on a public website once you exceed a certain volume of map calls.

Mathematica should be able to make the API calls directly (although I have not tried this). If you get it to work it would be great to post the code (minus your API key!)

From what little I know about the API you get the best resolution from querying individual points but that will result in many API calls. You probably want to send straight line paths to the API and get the elevation along the path. In fact you can probably make a back and forth path and get the entire x-y-z map with one API call.

I hope this helps. I'd be curious if you are successful with this.

Regards

Neil

POSTED BY: Neil Singer
Posted 7 years ago

Thanks, Neil, for pointing me towards the Google elevation product. It does a great job of displaying elevation maps. The data is difficult to extract though. I think I'll keep looking for a data set that I can import as a block or image into Wolfram, as with the ArcGRID data for the US.

I (we) will solve the problem, and when I know the solution I'll post it. : )

POSTED BY: Mark Greenberg

Mark,

In hindsight I would not be surprised if Wolfram got their GeoElevationData[] data from Google API calls! If this is the case than you would be no better of going to Google. Maybe someone at Wolfram can comment on this.

One other option -- If you found file formats that are available for the areas you want in the resolution you want but Wolfram does not support the file format, post the file types here -- maybe someone knows of some library or Source code to read the file and you can call the decoder from MMA.

Regards

POSTED BY: Neil Singer

Dear Mark,

this is a really nice plot and I'd love to play with that sort of data, but it would help of you provided more information about what dataset you used, and what your code was. Also, which other sites did you look at for more data. It is difficult to say anything constructive without some code and information about the datasets.

Cheers,

Marco

POSTED BY: Marco Thiel
Posted 7 years ago

Hi, Marco. The data set comes from the United States Geological Survey's "National Map." It's free and anyone can access it. They have an interactive viewer here. Zoom in to the part of the United States you are interested in and then select "Elevation Products (3DEP)." In the search filters, select "1 arc-second DEM," which gives data spaced about 30 meters apart. They offer higher resolution data, but the files are too large. Also select "ArcGrid" as the file format because Wolfram can read those types of files. Then click "Find Products" and it will tell you which data set contains the area you have selected in the map.

Then I use the following code to see a relief image of the terrain:

img = Import[ "/Path/n64w151.zip", {"ARCGrid", "ReliefImage"}, ImageSize -> 480]

Here is such a map. Unfortunately, on this one the mountain I was trying to make a model of, Denali, is right on the edge of the map in the lower left corner.

enter image description here

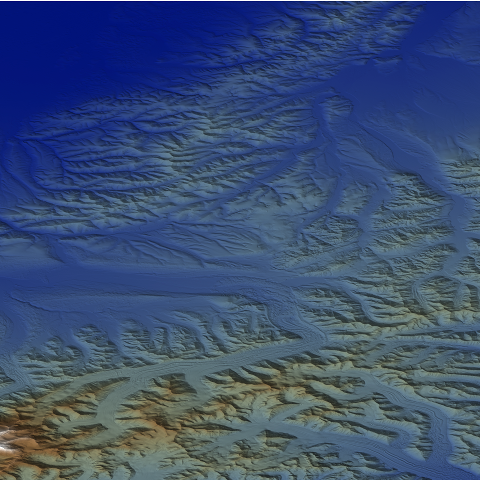
The data covers one degree longitude by one degree latitude, so the mountains are small features in the image. I find the mountain I am interested in by comparing this image to Google Maps. I use the following code to crop the image until I have framed the mountain just the way I want.

ImageTake[img, {750, 1050}, {1500, 1800}]

Then I use the following code to extract the data and make the model (3612 is the pixel with and height of the data):

smData=data[[3612-1050;;3612-750,1500;;1800]];
Export["/Path/Denali.dat", smData];
model = 
 ListPlot3D[smData, PlotStyle -> RGBColor["#bcdcdd"], Mesh -> None, 
  Boxed -> False, Filling -> Bottom, 
  FillingStyle -> {Brown, Opacity[1]}, Axes -> {False, False, True}, 
  ImageSize -> 480]

The data is arranged in a very similar way to Wolfram's ImageData[], except that instead of colors, each pixel location contains an elevation number in meters. ListPlot3D[] takes the data directly.

That's how I make a model of a mountain. However, the ArcGRID file format seems to be limited to geography in the United States. Wolfram imports a variety of elevation file formats, and there are dozens of data sets out there for the rest of the world, but I have yet to find a data set for non-US terrain that I can import into Wolfram. Here is a link to what appears to be the most comprehensive site on the subject. I did search other sites, but I'm not an expert in the field, so I probably overlooked the answer while I was searching.

Hope this helps.

POSTED BY: Mark Greenberg
Reply to this discussion
Community posts can be styled and formatted using the Markdown syntax.
Reply Preview
Attachments
Remove
or Discard

Group Abstract Group Abstract