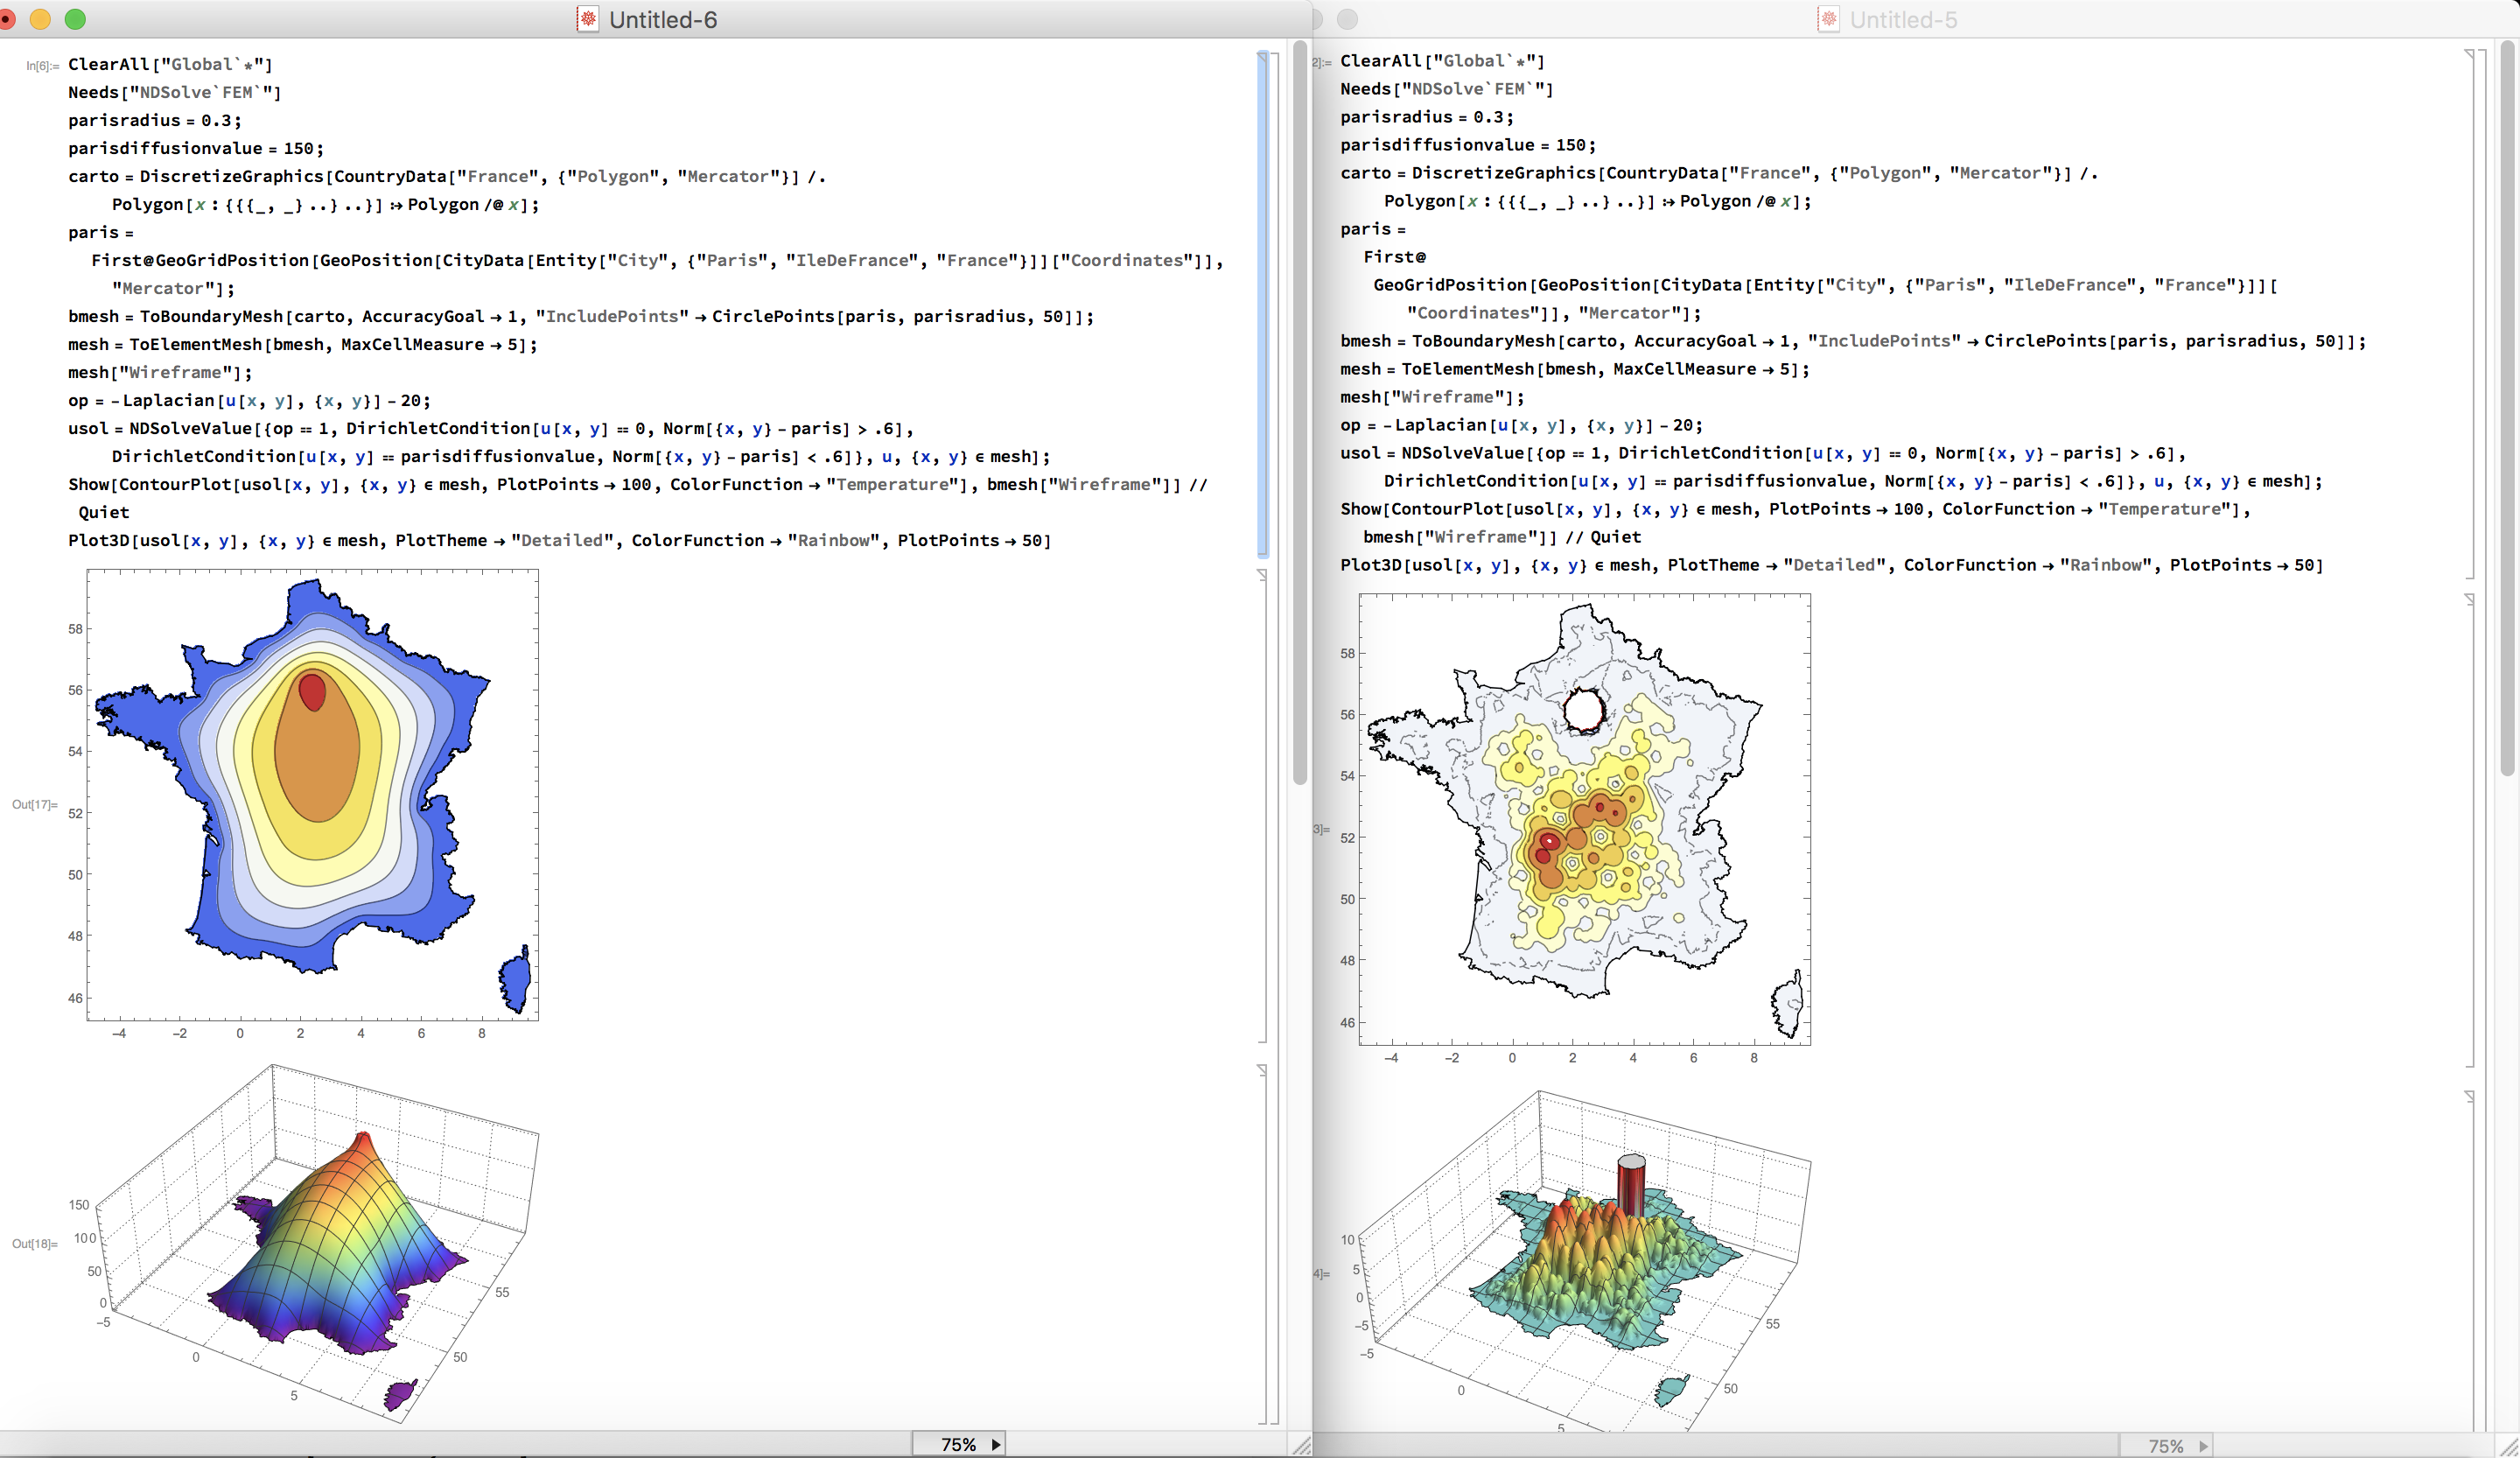
I can reproduce this. Left MMA 11.1.1 right MMA 11.2:
I have tried lots of examples from my lectures and the tutorials and have not found any other problems though.
Best wishes,
Marco
PS: I really, really like your book on Geographical Models with Mathematica. In fact, your post is similar to programs 10.4 and 10.5 in your book. I notice that in the book you produced the mesh like this:
carto = DiscretizeGraphics[CountryData["France", {"Polygon", "Mercator"}]]
which does not appear to work anymore and which you substituted by a more complicated procedure in the present code. Why is
carto = DiscretizeGraphics[CountryData["France", {"Polygon", "Mercator"}]]
not working anymore?
If I change your code to
ClearAll["Global`*"]
Needs["NDSolve`FEM`"]
parisradius = 0.3;
parisdiffusionvalue = 1.5;
carto = DiscretizeGraphics[
CountryData["France", {"Polygon", "Mercator"}] /. Polygon[x : {{{_, _} ..} ..}] :> Polygon /@ x];
paris = First@
   GeoGridPosition[
    GeoPosition[
     CityData[Entity["City", {"Paris", "IleDeFrance", "France"}]][
      "Coordinates"]], "Mercator"];
bmesh = ToBoundaryMesh[carto, AccuracyGoal -> 1];
mesh = ToElementMesh[bmesh, MaxCellMeasure -> 5];
mesh["Wireframe"]
op = -Laplacian[u[x, y], {x, y}] - 20;
usol = NDSolveValue[{op == -1, DirichletCondition[u[x, y] == 0, True]}, u, {x, y} \[Element] mesh];
Show[ContourPlot[usol[x, y], {x, y} \[Element] mesh,
ColorFunction -> "Temperature"], bmesh["Wireframe"]]
I get:
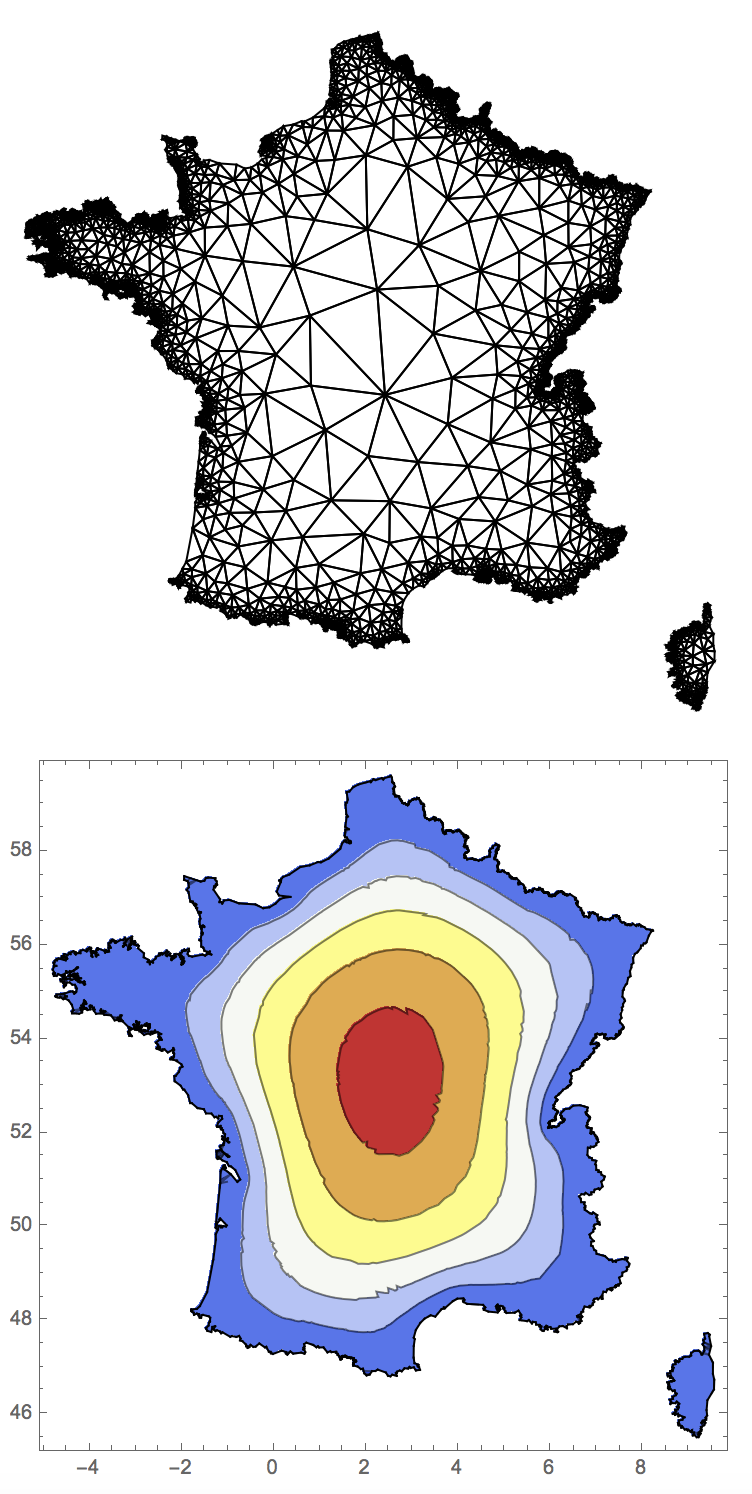
which is somewhat better....
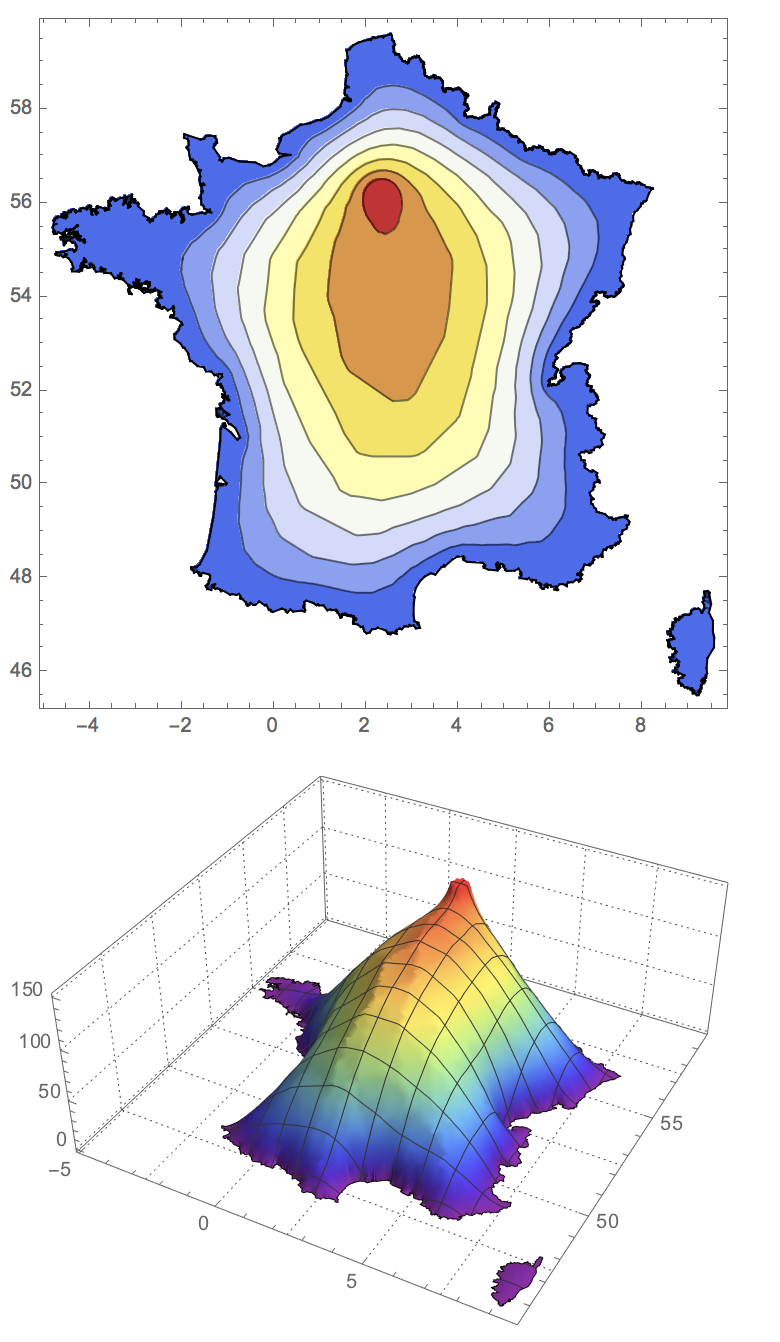
In fact, if you add the option "MeshOrder" -> 1 in the ToElementMesh function, you get much closer to what you want, I think:
ClearAll["Global`*"]
Needs["NDSolve`FEM`"]
parisradius = 0.3;
parisdiffusionvalue = 150;
carto = DiscretizeGraphics[
   CountryData["France", {"Polygon", "Mercator"}] /.
    Polygon[x : {{{_, _} ..} ..}] :> Polygon /@ x];
paris = First@
   GeoGridPosition[
    GeoPosition[
     CityData[Entity["City", {"Paris", "IleDeFrance", "France"}]][
      "Coordinates"]], "Mercator"];
bmesh = ToBoundaryMesh[carto, AccuracyGoal -> 1,
   "IncludePoints" -> CirclePoints[paris, parisradius, 50]];
mesh = ToElementMesh[bmesh, MaxCellMeasure -> 5, "MeshOrder" -> 1];
mesh["Wireframe"];
op = -Laplacian[u[x, y], {x, y}] - 20;
usol = NDSolveValue[{op == 1,
    DirichletCondition[u[x, y] == 0, Norm[{x, y} - paris] > .6],
    DirichletCondition[u[x, y] == parisdiffusionvalue,
     Norm[{x, y} - paris] < .6]}, u, {x, y} \[Element] mesh];
Show[ContourPlot[usol[x, y], {x, y} \[Element] mesh,
   PlotPoints -> 100, ColorFunction -> "Temperature"],
  bmesh["Wireframe"]] // Quiet
Plot3D[usol[x, y], {x, y} \[Element] mesh, PlotTheme -> "Detailed",
 ColorFunction -> "Rainbow", PlotPoints -> 50]
Yes, that could be it. The default in 11.2 and in 11.1.1 is "MeshOrder" -> 2. In 11.1.1 the "MeshOrder" doesn't appear to change the output much, and I can take values larger than 2. In 11.2 I can only change from 2 to 1 and the output depends very critically on the choice.


