I recently saw a gif showing the growth of a Voronoi diagram on this wiki page. This gif shows a Voronoi diagram but restricts each cell to lie in a disk that slowly grows over time.
I decided to recreate this with the Wolfram Language and thought I'd share the code and final result here.
Visualization
First and foremost, here's the result:
Code
First I start off with 20 random points in 2D:
pts = RandomReal[{-1, -1}, {20, 2}];
Then I extract each point's Voronoi cell by calling VoronoiMesh and then arranging the primitives to correspond to pts.
voronoi = VoronoiMesh[pts, {{-1, 1}, {-1, 1}}];
prims = BoundaryDiscretizeRegion /@ MeshPrimitives[voronoi, 2];
prims = Table[First[Select[prims, RegionMember[#, p] &]], {p, pts}];
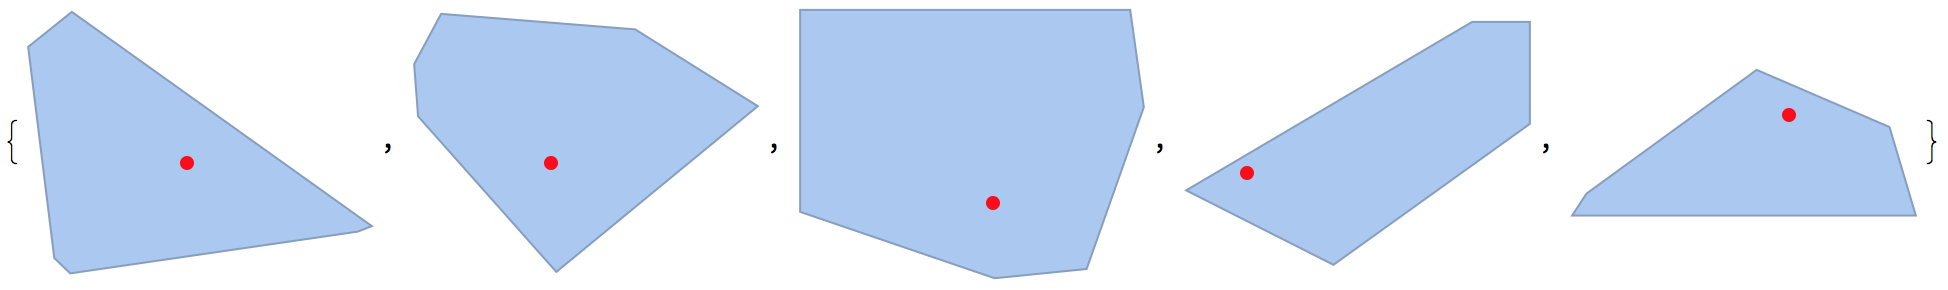
Let's quickly pause to make sure the cells correspond to the correct point.
MapThread[Show[#1, Epilog -> {Red, PointSize[Large], Point[#2]}] &, {prims, pts}][[1 ;; 5]]
Now that we have the primitives, we can show the scene with disks of radius $r$ by applying RegionIntersection at each cell with a disk of radius $r$.
First we will discretize a disk to force RegionIntersection to return a BoundaryMeshRegion.
disk[{x_, y_}, d_, n_:100] := BoundaryMeshRegion[CirclePoints[{x, y}, d, n], Line[Mod[Range[n + 1], n, 1]]]
Now at radius $r$ we intersect, which I packed into a function. First, here's the code for a single cell. It will take the Voronoi cell, its corresponding point, and a color for styling purposes.
colors = RandomColor[RGBColor[_, _, _, 0.3], 20];

PartialVoronoiCell[r_][p_, cell_, color_] :=
  BoundaryMeshRegion[
    RegionIntersection[disk[p, r], cell],
    MeshCellStyle -> {1 -> Directive[Thick, GrayLevel[.5]], 2 -> color}
  ]
The main function will effectively map over each point. When $r \leq 0$, we just show the points.
PartialVoronoiCells[_?NonPositive] = Graphics[Point[pts], PlotRange -> {{-1, 1}, {-1, 1}}, PlotRangePadding -> Scaled[.0125]];

PartialVoronoiCells[r_] :=
  Show[
    MapThread[PartialVoronoiCell[r], {pts, prims, colors}],
    Epilog -> Point[pts], PlotRange -> {{-1, 1}, {-1, 1}}, PlotRangePadding -> Scaled[.0125]
  ]
This function is fast enough to visualize the growth with Manipulate.
Manipulate[PartialVoronoiCells[r], {r, 0, 1}]