I agree that the Position function is a viable option, but keep in mind that FindPeaks gives the x-position of the maxima by default. so something like:
sol = {1, -1}*FindPeaks[-m, 0, 0, -Infinity][[1]]
would give you x and y position of the first minimum. If you use
sol = {1, -1}*# & /@ FindPeaks[-m, 0, 0, -Infinity]
you get the same for all minima. Using Mariusz' notation:
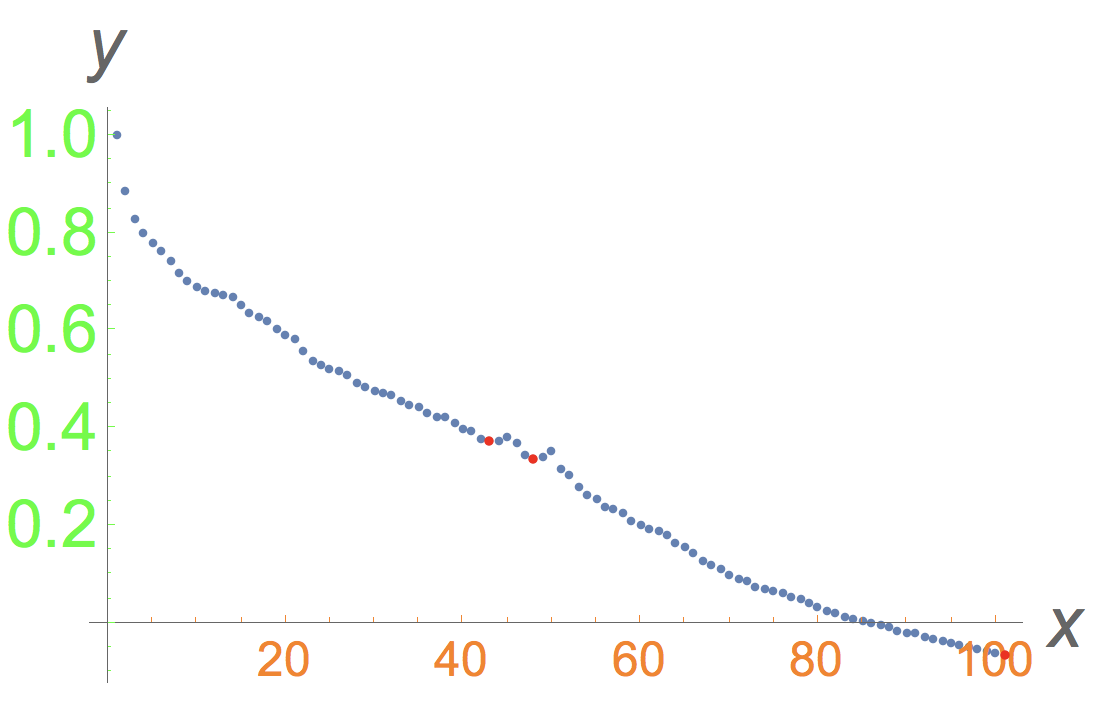
ListPlot[CorrelationFunction[data, {100}],
 TicksStyle -> {{FontSize -> 16, Orange}, {FontSize -> 22, Green}},
 PlotRange -> All, AxesLabel -> {Style[x, Large], Style[y, Large]},
 Epilog -> {PointSize[0.01], Red, Point /@ sol}]
gives:
Cheers,
Marco


