I want to plot a specific branch of the function $f(z) = \sqrt{z(z-1)}$ in the space $(x,y,w)$ where $x = \Re(z)$, $y = \Im(z)$ and $w = \Re(f(z))$.
Let $z = r_1 e^{i\theta_1}$ and $z-1 = r_2 e^{i\theta_2}$. We can then rewrite $f(z) = \sqrt{r_1 r_2} e^{i \frac{\theta_1+\theta_2}{2}}$. In theory, I can get a branch by specifying a constraint on $\arg(z) = \theta_1$ and $\arg(z-1) = \theta_2$ to the program. For example let's suppose $0 \leq \theta_1 < 2\pi$ and $-\pi \leq \theta_2 < \pi$.
Because I want to use $\theta_1$ and $\theta_2$ as parameters to ParametricPlot3D, I need to express $r_1$ and $r_2$ with respect to $\theta_1$ and $\theta_2$ :
Simplify[
            ExpToTrig[
               Solve[r2 Exp[I ?2] + 1 == r1 Exp[I ?1], Element[{r1, r2}, Reals]]],
               {Element[{?1, ?2}, Reals],
            0 <= ?1 < 2 Pi, -Pi <= ?2 < Pi}][[1]]
It shows :
{r1 -> -Csc[?1 - ?2] Sin[?2],
 r2 -> -Csc[?1 - ?2] Sin[?1]}
So I create new variables $r_1$ and $r_2$ :
r1 = -Csc[?1 - ?2] Sin[?2]
r2 = -Csc[?1 - ?2] Sin[?1]
I then define the function $f(z)$ :
f[?1_, ?2_] = Sqrt[r1*r2]*Exp[I *(?1 + ?2)/2]
Finally, I plot :
ParametricPlot3D[{r1 Cos[?1], r1 Sin[?1], Re[f[?1, ?2]]}, {?1, 0, 2 Pi}, {?2, -Pi, Pi}, Mesh -> None, AxesLabel -> {x, y, z}]
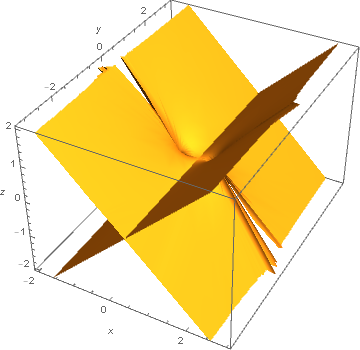
My question : How come that the plot did not generate a single branch of the function? How can I solve this problem?


