Message Boards Message Boards

0
|
6215 Views
|
3 Replies
|
2 Total Likes
View groups...
Share
Share this post:

Discrete event simulation similar to Harel/UML statecharts

I use Mathematica to develop methods for formal model-based user interface evaluation. Most of the methods require creating a finite state machine (FSM) of an interface, where the states are states of the interface and the transitions are actions initiated by the user. If you think about a 4 function calculator, the actions are all of the buttons and the state contains the contents of the display plus any internal variables required to compute the next visible state, given any button press. One way to create the FSM is to define a function that takes a button and the current state and produces the next state. Starting with the initial state of the device, a tree search produces a complete FSM for the interface.

As I apply these methods to more complex interfaces, It seems easier and more efficient to first model interfaces using something like UML/Harel statecharts, then convert those charts to an FSMs. Statecharts contain abstractions that greatly reduce the number of states and also make fairly complex event-driven behavior less error prone to model/program.

After downloading the trial of SystemModeler and spending a few hours working with it, I cannot tell at all whether I can create the kinds of event-driven models that I need, or even how to go about doing this. Modelica's Stategraph library claims to have Harel statechart power, but the modelica documentation is rather poor and all of the examples in SystemModeler/Modelica seem to use time-based or equation-based transitions. In contrast, Harel/UML statecharts are based on events (such as "+ pressed"). In addiiton, transitions can raise events that are then processed throughout the chart. In one example, I have two pull down menus. Making a choice from the first does not affect the second, but making a choice in the second, sets the first to the same value. The statechart I've attached here is showing the model for one of these pull down menus. In this case, there are two orthogonal parts to the state: the menu is either open or closed and is simultaneously in one of the states shown on the right.

So my question is whether this is possible in SystemModeler and, if so, is it possible to find better documentation/examples on how to do it?

Second, it is possible to see the chart with the current state(s) highlighted as I send events to it? In the attached image, the yellow states are active and I can click events from an event list (not shown) to trigger the next event and state transition.

Right now, I'm using Yakindu statechart tools (the source of this image), because it is free to me, and allows graphical simulation while viewing the statechart. Yakindu can create Java code of the statechart that I can then access from MMA to build the FSM using depth-first search over the event and state space. Unfortunately, Yakindu is based on Eclipse and its user interface leaves a lot to be desired, plus I've not found a way to edit the textual descriptions of the model (which is often easier than using a GUI).

Todd

Attachments:
POSTED BY: Todd Johnson
3 Replies

Todd,

It sounds like you really want the model to run the way it was originally constructed in the example with buttons. The way to set the buttons is by putting an array of transition times (button on/off) in the dialog for the buttons. Alternatively you can create sets of these on/off times in MMA and pass them into SystemModeler and run the simulation (either run from MMA or SystemModeler). In fact I like using the workflow of deriving data in MMA and sending it to SystemModeler and then running the model in SystemModeler -- The SystemModeler interface is better for viewing. You can also do this with a lookup table in SystemModeler without using MMA at all.

As far as creating the model, I think it should look close to the diagram you posted. If you are still open to trying WSM, I would contact the applications people in Sweden and they can probably help you with modeling best practices for State Machines of the type you describe.

Regards

Neil

POSTED BY: Neil Singer

Yes, this is very helpful. I had looked at the tank controller example, but I had no idea how to change the buttons during the simulation. Its a bit strange that it is so easy to create complex electric circuits, but so hard to replicate a Harel statechart. The semantics seem to be far removed from the semantics of Harel Statecharts. For instance, the statechart models that I make don't have or require real time simulation. In a Harel statechart the actions are labels on transitions between states. If I raise an action (e.g., user presses clickOverride above), the statechart on the right shifts state from closed to open, then the machine stops until I send it another action. At this point, the action was consumed by the model: the actions are not booleans. Now, clickOverride is no longer a possible action on the closed/open statechart. The entire chart above is an orthogonal state, where the device is always in one of the states in region r1 AND one of the states in region r2. The transitions on the right of the diagram (e.g., lifeSaving [active(overridePDM.r1.open)] provide a shorthand to indicate that once the open state is active on the left of the diagram, any of the menu items can be selected. So if I raise lifeSaving, the lifeSaving state in r2 becomes active, and state, overridePDM, raises a click event (see the text above r1). The click event is added to an action queue, such that once lifeSaving completes the transition, the model generates a click event, which then closes the menu in region 1. Without this kind of shorthand notation, I would have to draw a transition between all pairs of the menu options.

Harel statecharts also define shallow history and deep history nodes, such that on exit, compound states automatically remember their state and then return to the previous state when entered again.

It is unclear to me how modelica could consume events. When you set button to 1, it appears to stay that way until button is set to a different number. I tried to do just the model in region 1 above in Modelica, following the tank controller example, but didn't get very far. It was also far more complex than the chart above. In region r1 above there is nothing else to specificy other than two lines to indicate that clickOverride and click are events that are available externally.

Now I'm sure there is some way to do this in Modelica, but it seems much harder than using a purpose-built statechart tool. Since Yakindu statemachines precisely do what I want, I will use those for now. I'm nearly done with the Jlink interface to access the models from MMA. I can't show diagrams in MMA, but Yakindu has that feature built in.

At some point I will return to Modelica and see if I can work out the Harel->Modelica conversion. If I can, I will write it up a tutorial.

Todd

POSTED BY: Todd Johnson

Todd,

You should be able to do what you want. The example ControlledTanks shows how to specify button presses at particular times you can modify this to do other inputs. Is this what you want? I am guessing that you are actually interested in real time simulation so you can type inputs, push buttons, select menus while the simulation runs in real time and changes states.

If you are interested in real time simulation than you need to run the SystemModeler model from Mathematica. Doing this you can also view the chart with highlighted states in real time. As a simple example, I took the ControlledTanks example and modified it to take an input from Mathematica. The file is attached with a Mathematica notebook showing how to run it and interact with it.

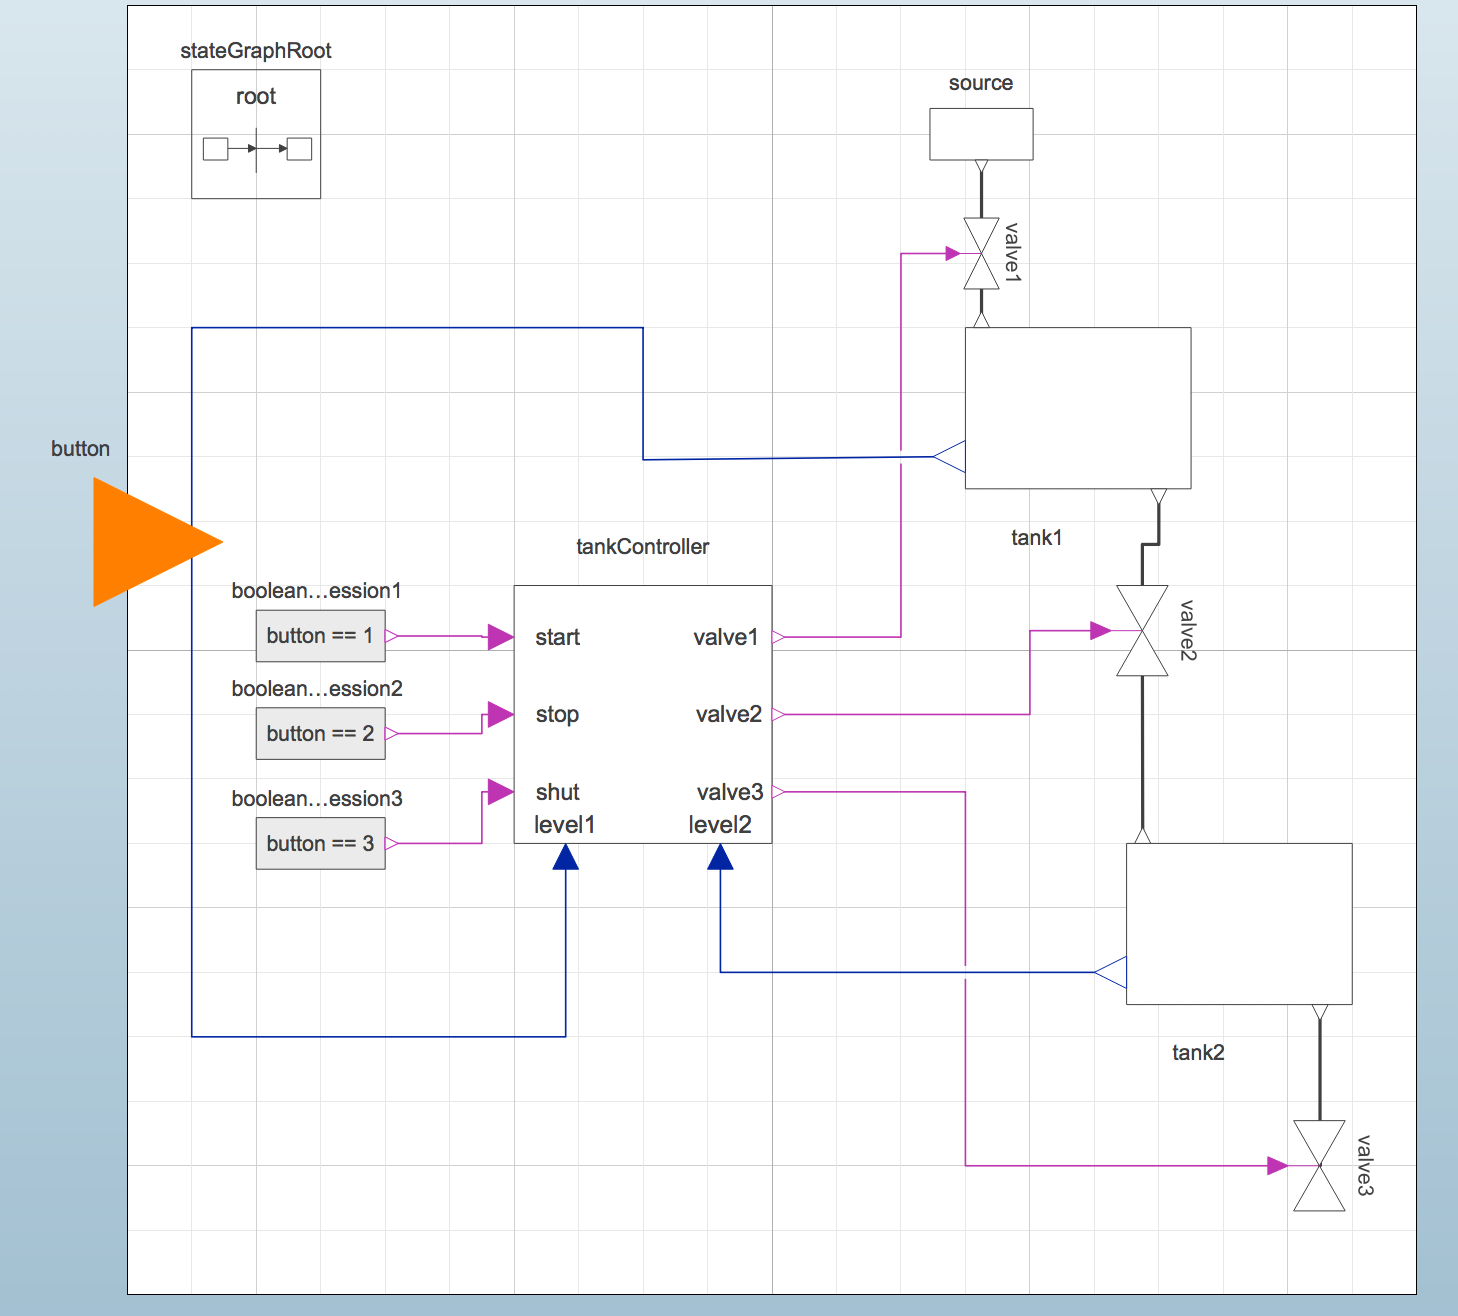
The modified diagram has one input -- "button" and based on whether button is 1,2, or 3 it "pushes" the "start", "stop", or "shut" button. This is the only change I made to the built-in example.

enter image description here

In Mathematica you connect to the simulation to do a real time 200 second run

Needs["WSMLink`"]

conn = WSMRealTimeSimulate["NewControlledTanks", 200]

I use the Mathematica variable "buttonInteger" for my input so initialize it to zero and connect it to the simulation:

buttonInteger = 0;

WSMLink`Simulate`SetInputs[conn, "button" -> (buttonInteger &)]

Next, start the simulation (or click on the play button in the graphic returned by the WSMRealTimeSimulate). Define some Mathematica controls to use to set "buttonInteger". then display the tankcontroller state machine inside of the Simulation. The reason I show the tankcontroller and not the whole model is because the only dynamic graphics are inside the controller and there is nothing to see at the top level. In your model if everything is at the main level you would use just conn["Diagram", ImageSize...

conn["Start"]

SetterBar[
 Dynamic[buttonInteger], {1 -> "Start", 2 -> "Stop", 3 -> "Shut"}]

Dynamic[Refresh[conn[{"Diagram", "tankController"}, ImageSize -> 500],
   UpdateInterval -> 0.05, TrackedSymbols :> {}]]

You can then stop your simulation by clicking the stop button or executing:

conn["Stop"]

Here is the result of all this:

enter image description here

I hope this helps.

Regards,

Neil

Attachments:
POSTED BY: Neil Singer
Reply to this discussion
Community posts can be styled and formatted using the Markdown syntax.
Reply Preview
Attachments
Remove
or Discard

Group Abstract Group Abstract