Click on the image to zoom. Then click your browser back button to return to reading the post.
Intro
This is a response to the [CALL] Reddit DataViz Battle JAN2018: Visualize the Growth Rates of Algae:
http://community.wolfram.com/groups/-/m/t/1257547
Details
A think the idea behind a good visualization is that all hidden information is reflected clearly. Here are a few observations about this dataset.
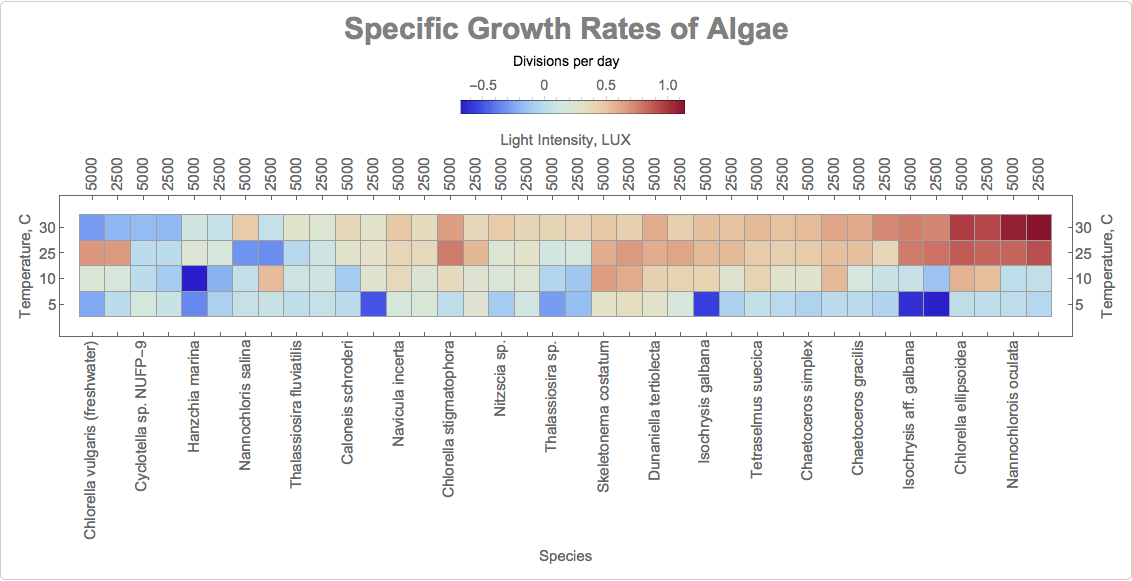
The same Species could be compared at different Light Intensities. Hence keep heatmap cells for those close, do not separate, as sapce-separated colors (like in different plots) are very hard to sense and compare due various optical illusions.
Different Species have different response to light and temperature and can be compared to each other. A good way to compare them is to sort them somehow to see growth of responsiveness. Stacked up heat map cells will smoothly grow by the sort design and any noise fluctuations will be easily seen.
At higher temperatures data seems less noisy. So I will perform sorting at highest temperatures.
Let me know if you can suggest improvements. I welcome any comments about design quality. Or post your own solutions.
The dataset is located at a web page: http://aquatext.com/tables/algaegrwth.htm
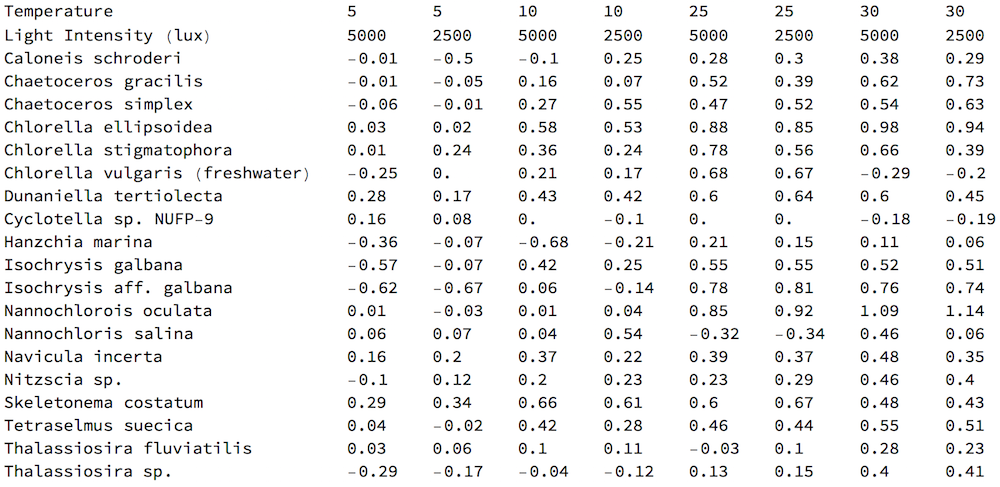
The nature of the data is clear from the website description. It is easy to get the raw data with the following WL command:
raw = Import["http://aquatext.com/tables/algaegrwth.htm", "Data"] /."0..06" -> .06;
You need /."0..06" -> .06 because the data has a clerical error resulting in the import of a string instead of a number. One way of obtaining a simple rectangular array / table of data is:
data=Cases[raw, {_String,__?NumberQ},Infinity]/.
x_List/;First[x]=="Temperature":>{"Temperature",5,5,10,10,25,25,30,30};
which can be viewed as
TableForm[data]
First I create a Dataset for more convenient data manipulations.
set = Dataset[data][[3 ;; -1]][SortBy[#[[9]] &]]
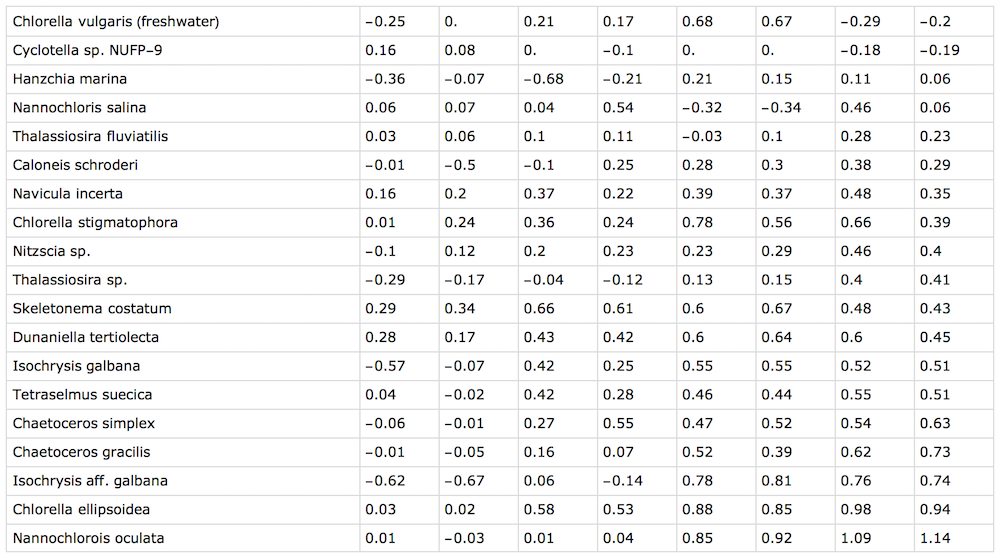
Note I sorted data by the last column as it seems that higher temperatures have less relative fluctuations more definite "shape". Now partition 2500 and 5000 LUX separately:
riff=Riffle[Normal[set[All,2;;-1;;2]],Normal[set[All,3;;-1;;2]]];
Next define some style variables:
side=Transpose[{Range[4],{5,10,25,30}}];
base=Transpose[{Range[38],Flatten[{Rotate[#,Pi/2],""}&/@Normal[set[All,1]]]}];
top=Transpose[{Range[38],Rotate[#,Pi/2]&/@Flatten[Table[{5000,2500},19]]}];
title=Style["Specific growth rates of algae",30,Gray,Bold,FontFamily->"Arial"];
and build the visualization presented at the top of this post :
Framed[
Labeled[
    ArrayPlot[
       Transpose[riff],
       ColorFunction->"ThermometerColors",Mesh->All,Frame->True,DataReversed->True,
       ImageSize->1100,FrameTicks->{{side,side},{base,top}},BaseStyle->15,
       FrameLabel->{{"Species","Light Intensity, LUX"},{"Temperature, C","Temperature, C"}},
       PlotLegends->Placed[BarLegend[Automatic,LegendMarkerSize->250,
       LegendLabel->"divisions per day",LabelStyle->14],Top]],
title,Top],
RoundingRadius->5,FrameStyle->Opacity[.2],FrameMargins->15]


