On November 13th, 2017 the American College of Cardiology and American Heart Association released a massive document centered on the prevention, detection, evaluation and management of high blood pressure in adults.
http://hyper.ahajournals.org/content/early/2017/11/10/HYP.0000000000000065
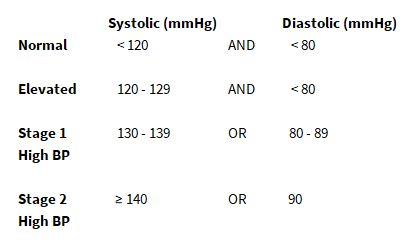
New blood pressure categories were established:
While the decision about when to modify lifestyle habits and/or introduce or change medications is best left to discussions between each person and their family physician / cardiologist, there is no reason we can't rely on our favorite computing platform - Mathematica - to help us organize data typically collected through home blood pressure monitoring.
I currently use a blood pressure application called "Blood Pressure Log - My Diary" (via GooglePlay) written by Dr. Tomasz Jan Zlamaniec to record my sphygmomanometer readings - specially my systolic & diastolic blood pressure values, as well as heart rate. The application automatically records the date and time of the data entered. It is a simple matter of exporting the data (csv, xlsx format) to be organized and summarized by Mathematica. The application exports 5 columns of data, including date, time (in 24 hour format), systolic bp, diastolic bp, heart rate (in beats per minute).
Importing the data from the application into Mathematica looks as follows:
mydata = Drop[
  Flatten[Import["C:\\Users\\Todd's PC\\Desktop\\Todd BP scrubbed.xlsx",
    "Data"], 1], None, {2}]
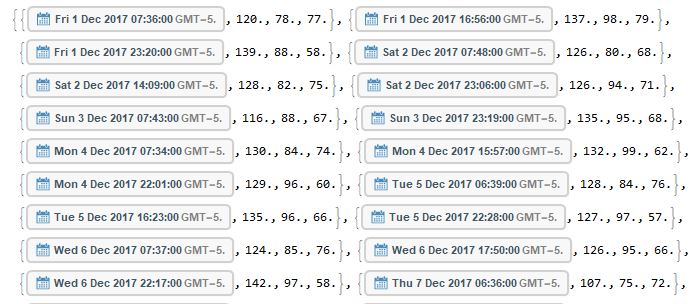
You'll note that Mathematica automatically collapses the date and time into a single DateObject[], which is why we are left with 4 columns of data instead of the initial 5 exported from the blood pressure application. (Mathematica does preserve the 5 column data structure by inserting data that is not useful to me, so I Drop it after the import.)
I've created some code (notebook attached & printed below) that will produce graphical and statistical output simply by sending <mydata> to a function called <bpdashboard>.
bpdashboard[mydata]
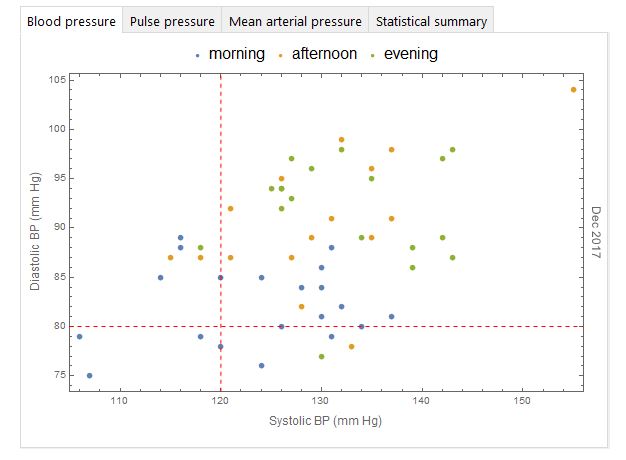
Tab 1 (Blood Pressure): A ListPlot of your personal systolic (x-axis) and diastolic (y-axis) values. Data points are wrapped in tooltip and will report their values when you place your cursor over them. The data is color coded according to the time of day the value was recorded. Morning is defined as 0100 to 1159 hours. Afternoon 1200 to 1759 hours and evening from 1800 to 2459 hours.
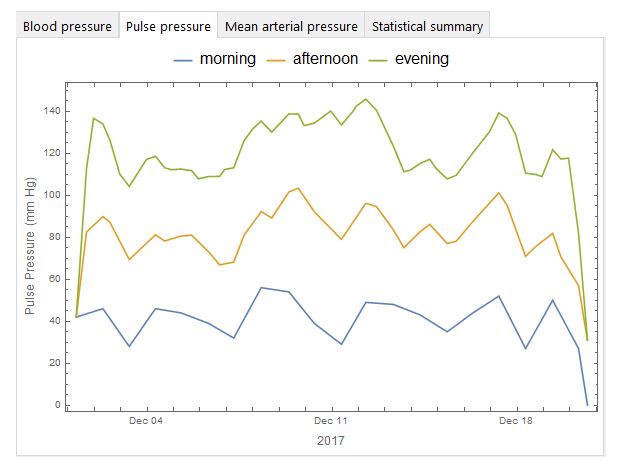
Tab 2 (Pulse Pressure): A DateListPlot of your pulse pressure. Pulse pressure is the difference between systolic and diastolic values. Normal pulse pressure is considered 40mmHg. Note that data is displayed in a stacked format to make it easier to see morning, afternoon, and evening data on the same plot.
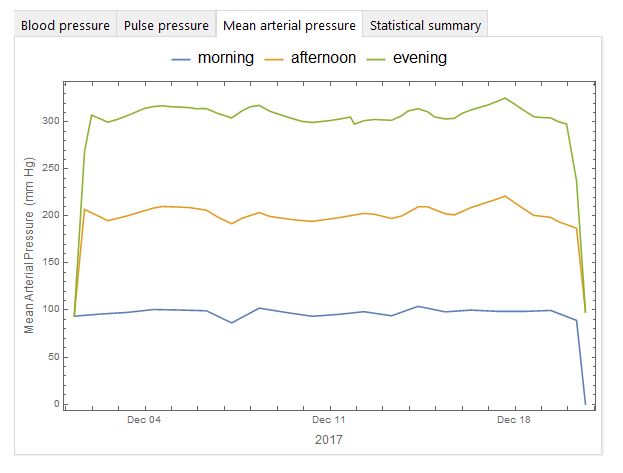
Tab 3: A DateListPlot of your mean arterial pressure. Mean arterial pressure is defined as the average blood pressure in a patient's arteries during one cardiac cycle. MAP is generally considered normal in the 60 - 110 mmHg range. As in Tab 2, the data is plotted in a stacked format.
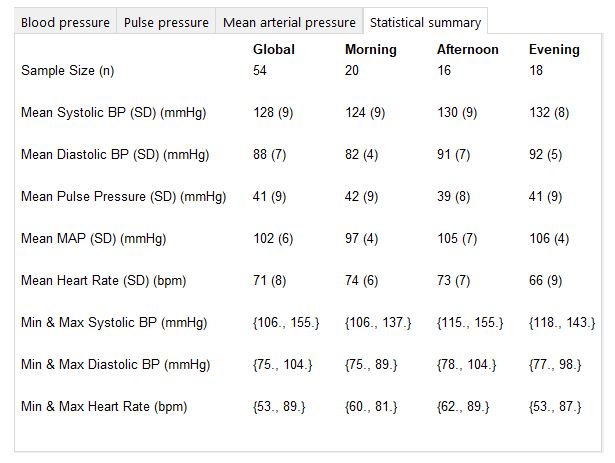
Tab 4: A statistical summary reporting many self explanatory vital statistics. SD = standard deviation; bpm = beats per minute; MAP = mean arterial pressure
My goal in creating such a program is to be able to produce monthly status reports on my cardiovascular health, print the data as desired, and take the information along to office visits as necessary. Feel free to use and modify for your own purposes.
Wishing everyone good cardiovascular health in 2018!
bpdashboard code:
The code for bpdashboard is self contained inside a Module for the sake of clarity and organization. Upon execution, bpdashboard organizes the blood pressure data sent to it, and creates a simple user interface using TabView to facilitate graphical interpretation of the data as well as providing a statistical summary of various metrics computable from blood pressure data. Interested readers will note that mean arterial pressure (MAP) is calculated through the use of a formula originally published here:
https://www.jstage.jst.go.jp/article/ahs1995/14/6/14_6_293/_article
bpdashboard[mydata_] :=
 Module[{afterdiasbpminmax, afterheartrateminmax, aftermeandiasbp,
   aftermeanheartrate, aftermeanmap, aftermeanpulpre, aftermeansysbp,
   afternoonbp, afternoondata, afternoonpos, afterstdevdiasbp,
   afterstdevheartrate, afterstdevmap, afterstdevpulpre,
   afterstdevsysbp, aftersysbpminmax, bpplot, diasbp,
   evendiasbpminmax, evenheartrateminmax, eveningbp, eveningdata,
   eveningpos, eveningstdevdiasbp, evenmeandiasbp, evenmeanheartrate,
   evenmeanmap, evenmeanpulpre, evenmeansysbp, evenstdevheartrate,
   evenstdevmap, evenstdevpulpre, evenstdevsysbp, evensysbpminmax,
   globaldiasbpminmax, globalheartrateminmax, globalmeandiasbp,
   globalmeanheartrate, globalmeanmap, globalmeanpulpre,
   globalmeansysbp, globalminmaxdiasbp, globalminmaxheartrate,
   globalminmaxsysbp, globalstdevdiasbp, globalstdevheartrate,
   globalstdevmap, globalstdevpulpre, globalstdevsysbp,
   globalsysbpminmax, heartrate, mapafternoon, mapevening, mapmorn,
   mapplot, meanarterialpressure, mornbp, morndata, morndiasbpminmax,
   mornheartrateminmax, mornmeandiasbp, mornmeanheartrate,
   mornmeanmap, mornmeanpulpre, mornmeansysbp, mornpos,
   mornstdevdiasbp, mornstdevheartrate, mornstdevmap, mornstdevpulpre,
    mornstdevsysbp, mornsysbpminmax, ppplot, pulpresafter,
   pulpreseven, pulpresmorn, samplehrs, samplesize, statreport, sysbp},


  samplesize = Length[mydata];(* number of data points /
  blood pressure measurements  *)

  Length[Union[DateValue[mydata[[All, 1]], "Day"]]];(*
  number of days in dataset *)

  samplehrs = DateValue[mydata[[All, 1]], "Hour"];(*
  time of day (hour units) measurements taken *)

  mornpos = Flatten[Map[Position[samplehrs, #] &, Range[11]], 1];(*
  position of morning data; morning from 0100 to 1159 hours *)

  afternoonpos =
   Flatten[Map[Position[samplehrs, #] &, Range[12, 17]], 1];(*
  position of afternoon data; afternoon from 1200 to 1759 hours *)

  eveningpos =
   Flatten[Map[Position[samplehrs, #] &, Range[18, 24]], 1];(*
  position of evening data; evening from 1800 to 2459 hours *)

  meanarterialpressure[{sysbp_, diasbp_, heartrate_}] := Module[{map},
    map =
     diasbp + 0.01*Exp[4.14 - (40.74/heartrate)]*(sysbp - diasbp)];

  morndata = Extract[mydata, mornpos];

  afternoondata = Extract[mydata, afternoonpos];

  eveningdata = Extract[mydata, eveningpos];

  mornbp = MapThread[List, {morndata[[All, 2]], morndata[[All, 3]]}];

  afternoonbp =
   MapThread[List, {afternoondata[[All, 2]], afternoondata[[All, 3]]}];

  eveningbp =
   MapThread[List, {eveningdata[[All, 2]], eveningdata[[All, 3]]}];

  pulpresmorn =
   MapThread[
    List, {morndata[[All,
      1]], (morndata[[All, 2]] - morndata[[All, 3]])}];(*
  pulse pressure morning *)

  pulpresafter =
   MapThread[
    List, {afternoondata[[All,
      1]], (afternoondata[[All, 2]] - afternoondata[[All, 3]])}];(*
  pulse pressure afternoon *)

  pulpreseven =
   MapThread[
    List, {eveningdata[[All,
      1]], (eveningdata[[All, 2]] - eveningdata[[All, 3]])}];(*
  pulse pressure evening *)

  globalsysbpminmax = MinMax[mydata[[All, 2]]];

  globaldiasbpminmax = MinMax[mydata[[All, 3]]];

  mornsysbpminmax = MinMax[morndata[[All, 2]]];

  morndiasbpminmax = MinMax[morndata[[All, 3]]];

  aftersysbpminmax = MinMax[afternoondata[[All, 2]]];

  afterdiasbpminmax = MinMax[afternoondata[[All, 3]]];

  evensysbpminmax = MinMax[eveningdata[[All, 2]]];

  evendiasbpminmax = MinMax[eveningdata[[All, 3]]];

  globalheartrateminmax = MinMax[mydata[[All, 4]]];

  mornheartrateminmax = MinMax[morndata[[All, 4]]];

  afterheartrateminmax = MinMax[afternoondata[[All, 4]]];

  evenheartrateminmax = MinMax[eveningdata[[All, 4]]];

  globalmeansysbp = Mean[mydata[[All, 2]]];

  globalstdevsysbp = StandardDeviation[mydata[[All, 2]]];

  globalmeandiasbp = Mean[mydata[[All, 3]]];

  globalstdevdiasbp = StandardDeviation[mydata[[All, 3]]];

  mornmeansysbp = Mean[morndata[[All, 2]]];

  mornstdevsysbp = StandardDeviation[morndata[[All, 2]]];

  mornmeandiasbp = Mean[morndata[[All, 3]]];

  mornstdevdiasbp = StandardDeviation[morndata[[All, 3]]];

  aftermeansysbp = Mean[afternoondata[[All, 2]]];

  afterstdevsysbp = StandardDeviation[afternoondata[[All, 2]]];

  aftermeandiasbp = Mean[afternoondata[[All, 3]]];

  afterstdevdiasbp = StandardDeviation[afternoondata[[All, 3]]];

  evenmeansysbp = Mean[eveningdata[[All, 2]]];

  evenstdevsysbp = StandardDeviation[eveningdata[[All, 2]]];

  evenmeandiasbp = Mean[eveningdata[[All, 3]]];

  eveningstdevdiasbp = StandardDeviation[eveningdata[[All, 3]]];

  globalmeanheartrate = Mean[mydata[[All, 4]]];

  globalstdevheartrate = StandardDeviation[mydata[[All, 4]]];

  mornmeanheartrate = Mean[morndata[[All, 4]]];

  mornstdevheartrate = StandardDeviation[morndata[[All, 4]]];

  aftermeanheartrate = Mean[afternoondata[[All, 4]]];

  afterstdevheartrate = StandardDeviation[afternoondata[[All, 4]]];

  evenmeanheartrate = Mean[eveningdata[[All, 4]]];

  evenstdevheartrate = StandardDeviation[eveningdata[[All, 4]]];

  globalmeanpulpre =
   Mean[Flatten[{pulpresmorn[[All, 2]], pulpresafter[[All, 2]],
      pulpreseven[[All, 2]]}]];

  globalstdevpulpre =
   StandardDeviation[
    Flatten[{pulpresmorn[[All, 2]], pulpresafter[[All, 2]],
      pulpreseven[[All, 2]]}]];

  mornmeanpulpre = Mean[pulpresmorn[[All, 2]]];

  mornstdevpulpre = StandardDeviation[pulpresmorn[[All, 2]]];

  aftermeanpulpre = Mean[pulpresafter[[All, 2]]];

  afterstdevpulpre = StandardDeviation[pulpresafter[[All, 2]]];

  evenmeanpulpre = Mean[pulpreseven[[All, 2]]];

  evenstdevpulpre = StandardDeviation[pulpreseven[[All, 2]]];

  globalminmaxsysbp = MinMax[mydata[[All, 2]]];

  globalminmaxdiasbp = MinMax[mydata[[All, 3]]];

  globalminmaxheartrate = MinMax[mydata[[All, 4]]];

  mapmorn =
   MapThread[
    List, {morndata[[All, 1]],
     Map[meanarterialpressure[#] &, morndata[[All, 2 ;; 4]]]}];(*
  mean arterial pressure in the morning *)

  mapafternoon =
   MapThread[
    List, {afternoondata[[All, 1]],
     Map[meanarterialpressure[#] &, afternoondata[[All, 2 ;; 4]]]}];(*
  mean arterial pressure in the afternoon *)

  mapevening =
   MapThread[
    List, {eveningdata[[All, 1]],
     Map[meanarterialpressure[#] &, eveningdata[[All, 2 ;; 4]]]}]; (*
  mean arterial pressure in the evening *)

  globalmeanmap =
   Mean[Flatten[{mapmorn[[All, 2]], mapafternoon[[All, 2]],
      mapevening[[All, 2]]}]];

  globalstdevmap =
   StandardDeviation[
    Flatten[{mapmorn[[All, 2]], mapafternoon[[All, 2]],
      mapevening[[All, 2]]}]];

  mornmeanmap = Mean[mapmorn[[All, 2]]];

  mornstdevmap = StandardDeviation[mapmorn[[All, 2]]];

  aftermeanmap = Mean[mapafternoon[[All, 2]]];

  afterstdevmap = StandardDeviation[mapafternoon[[All, 2]]];

  evenmeanmap = Mean[mapevening[[All, 2]]];

  evenstdevmap = StandardDeviation[mapevening[[All, 2]]];

  bpplot =
   ListPlot[{Tooltip[mornbp], Tooltip[afternoonbp],
     Tooltip[eveningbp]},
    PlotLegends ->
     Placed[Map[
       Style[#, FontSize -> 16] &, {"morning", "afternoon",
        "evening"}], Top],
    PlotRange -> Full,
    ImageSize -> Large,
    Frame -> True,
    FrameLabel -> {{Style["Diastolic BP (mm Hg)", FontSize -> 12],
       Rotate[
        Style[StringJoin[
          Insert[Map[ToString[#] &,
            DateValue[mydata[[1, 1]], {"MonthNameShort", "Year"}]],
           " ", 2]], FontSize -> 12], 180 Degree]},
      {Style["Systolic BP (mm Hg)", FontSize -> 12], None}},
    Epilog -> {{Red, Dashed, InfiniteLine[{{120, 0}, {120, 10}}]},
      {Red, Dashed, InfiniteLine[{{0, 80}, {10, 80}}]}}];

  ppplot = DateListPlot[{pulpresmorn, pulpresafter, pulpreseven},
    PlotLayout -> "Stacked",
    PlotLegends ->
     Placed[Map[
       Style[#, FontSize -> 16] &, {"morning", "afternoon",
        "evening"}], Top],
    PlotRange -> Full,
    ImageSize -> Large,
    Frame -> True,
    FrameLabel -> {{Style["Pulse Pressure (mm Hg)", FontSize -> 12],
       None},
      {Style[DateValue[mydata[[1, 1]], "Year"], FontSize -> 12],
       None}}];

  mapplot = DateListPlot[{mapmorn, mapafternoon, mapevening},
    PlotLayout -> "Stacked",
    PlotLegends ->
     Placed[Map[
       Style[#, FontSize -> 16] &, {"morning", "afternoon",
        "evening"}], Top],
    PlotRange -> Full,
    ImageSize -> Large,
    Frame -> True,
    FrameLabel -> {{Style["Mean Arterial Pressure (mm Hg)",
        FontSize -> 12], None},
      {Style[DateValue[mydata[[1, 1]], "Year"], FontSize -> 12],
       None}}];

  statreport = TextGrid[
    {{"", Style["Global", Bold], Style["Morning", Bold],
      Style["Afternoon", Bold], Style["Evening", Bold]},

     {"Sample Size (n)", samplesize, Length[morndata],
      Length[afternoondata], Length[eveningdata]},

     {""},

     {"Mean Systolic BP (SD) (mmHg)",
      Row[{Round[globalmeansysbp], " (", Round[globalstdevsysbp],
        ")"}], Row[{Round[mornmeansysbp], " (", Round[mornstdevsysbp],
         ")"}],
      Row[{Round[aftermeansysbp], " (", Round[afterstdevsysbp], ")"}],
      Row[{Round[evenmeansysbp], " (", Round[evenstdevsysbp], ")"}]},

     {""},

     {"Mean Diastolic BP (SD) (mmHg)",
      Row[{Round[globalmeandiasbp], " (", Round[globalstdevdiasbp],
        ")"}],
      Row[{Round[mornmeandiasbp], " (", Round[mornstdevdiasbp], ")"}],
      Row[{Round[aftermeandiasbp], " (", Round[afterstdevdiasbp],
        ")"}],
      Row[{Round[evenmeandiasbp], " (", Round[eveningstdevdiasbp],
        ")"}]},

     {""},

     {"Mean Pulse Pressure (SD) (mmHg)",
      Row[{Round[globalmeanpulpre], " (", Round[globalstdevpulpre],
        ")"}],
      Row[{Round[mornmeanpulpre], " (", Round[mornstdevpulpre], ")"}],
      Row[{Round[aftermeanpulpre], " (", Round[afterstdevpulpre],
        ")"}],
      Row[{Round[evenmeanpulpre], " (", Round[evenstdevpulpre], ")"}]},

     {""},

     {"Mean MAP (SD) (mmHg)",
      Row[{Round[globalmeanmap], " (", Round[globalstdevmap], ")"}],
      Row[{Round[mornmeanmap], " (", Round[mornstdevmap], ")"}],
      Row[{Round[aftermeanmap], " (", Round[afterstdevmap], ")"}],
      Row[{Round[evenmeanmap], " (", Round[evenstdevmap], ")"}]},

     {""},

     {"Mean Heart Rate (SD) (bpm)",
      Row[{Round[globalmeanheartrate], " (",
        Round[globalstdevheartrate], ")"}],
      Row[{Round[mornmeanheartrate], " (", Round[mornstdevheartrate],
        ")"}],
      Row[{Round[aftermeanheartrate], " (",
        Round[afterstdevheartrate], ")"}],
      Row[{Round[evenmeanheartrate], " (", Round[evenstdevheartrate],
        ")"}]},

     {""},

     {"Min & Max Systolic BP (mmHg)", globalminmaxsysbp,
      mornsysbpminmax, aftersysbpminmax, evensysbpminmax},

     {""},

     {"Min & Max Diastolic BP (mmHg)", globalminmaxdiasbp,
      morndiasbpminmax, afterdiasbpminmax, evendiasbpminmax},

     {""},

     {"Min & Max Heart Rate (bpm)", globalheartrateminmax,
      mornheartrateminmax, afterheartrateminmax, evenheartrateminmax}
     },
    Spacings -> {2, Automatic}
    ];

  TabView[{"Blood pressure" -> bpplot, "Pulse pressure" -> ppplot,
    "Mean arterial pressure" -> mapplot,
    "Statistical summary" -> statreport}]
  ]
 Attachments:


