Message Boards Message Boards

0
|
25571 Views
|
13 Replies
|
4 Total Likes
View groups...
Share
Share this post:

[?] Plot two equations and find the intersection point?

Posted 6 years ago

Does anyone know how to plot these two equations x=cos x in the interval [0,[Pi]/2] and find the intersection point. Please help

POSTED BY: Lexie Tutwiler
13 Replies
Posted 6 years ago

Thank you so much last question I'm sorry you've been so helpful! Is there anything wrong with this input that it would only output one equation and not both? Plot[{Ln (x), 3 - x^2}, {x, 1, 2}]

POSTED BY: Lexie Tutwiler

Yes. Inputs to functions always go in square brackets. Also Ln is not a valid Mathematica function. A single equal sign at the beginning of the line fixes your syntactic mistake:

enter image description here

I would suggest that you do this course

https://www.wolfram.com/language/elementary-introduction/2nd-ed/

to get started with the Wolfram Language. A couple of pages and you should know why the input you used did not work.

Best wishes,

Marco

POSTED BY: Marco Thiel
Posted 6 years ago

This is what I tried Plot[{sin[e^x], x^2 - 1}, {x, 0, 2}]

POSTED BY: Lexie Tutwiler

Yes, that won't work. In Mathematica all functions start with a capital letter. Hence, sin needs to be Sin. Also the "e" is just a variable without any fixed value. If you mean the basis of the exponential function you will have to use E.

If you do not stick to the basic syntactic rules Mathematica will not evaluate.

IF you are not sure about how to type it in, you can also use "natural language input", i.e. you type a single "=" sign at the beginning of a line:

enter image description here

In many cases that fixes any syntactic errors.

Cheers,

Marco

Best wishes, Marco

POSTED BY: Marco Thiel
Posted 6 years ago

Also does anyone know how to plot these two equations sin(e^x)=x^2-1 in the interval [0,2] and find the intersection points???

POSTED BY: Lexie Tutwiler

The procedure is identical to the one outlined above! What have you tried? Even if you type your question just "as is" into WolframAlpha it works:

http://www.wolframalpha.com/input/?i=sin(e%5Ex)%3Dx%5E2-1

Cheers,

Marco

POSTED BY: Marco Thiel
Posted 6 years ago

I tried exactly what I did for the first one just switched out the equations but it appears that only the x^2 -1 equation is showing up on the graph.

POSTED BY: Lexie Tutwiler

How did you do that:

Plot[{Sin[E^x], x^2 - 1}, {x, 0, 2}]

enter image description here

Cheers,

Marco

PS: Note that the E needs to be capital.

POSTED BY: Marco Thiel
Posted 6 years ago

Also does anyone know how to plot these two equations sin(e^x)=x^2-1 in the interval [0,2] and find the intersection points???

POSTED BY: Lexie Tutwiler
Posted 6 years ago

Also does anyone know how to plot these two equations sin(e^x)=x^2-1 in the interval [0,2] and find the intersection points???

POSTED BY: Lexie Tutwiler

Hi Lexie,

I am not quite sure what you mean by "two equations", where you only give x=cosx. In theory this can be plotted using:

Plot[{x, Cos[x]}, {x, -1, 3}]

enter image description here

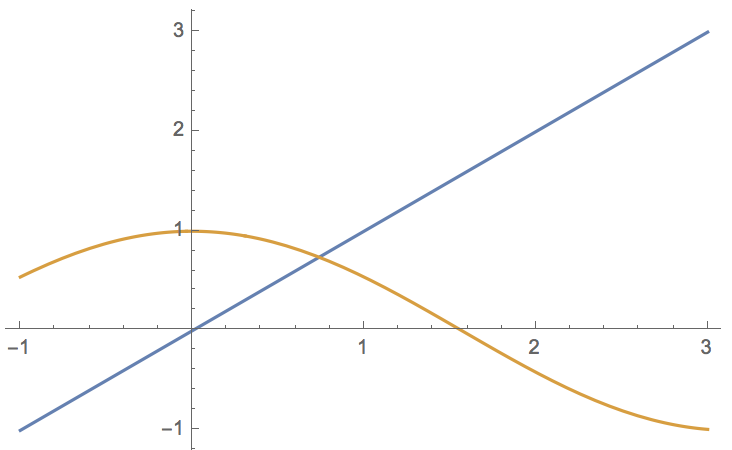
There are various ways to solve this. For example:

FindRoot[x == Cos[x], {x, 1}]
(*{x -> 0.739085}*)

or

NSolve[{x == Cos[x] && x > 0 && x < Pi/2}, x]
(*{{x -> 0.739085}}*)

Cheers,

Marco

POSTED BY: Marco Thiel
Posted 6 years ago

Thank you so much!! Do you know how to plot these two equations sin(e^x)=x^2-1 in the interval [0,2] and find the intersection points???

POSTED BY: Lexie Tutwiler
Posted 6 years ago

I tried exactly what I did for the first one just switched out the equations but it appears that only the x^2 -1 equation is showing up on the graph.

POSTED BY: Lexie Tutwiler
Reply to this discussion
Community posts can be styled and formatted using the Markdown syntax.
Reply Preview
Attachments
Remove
or Discard

Group Abstract Group Abstract