Details
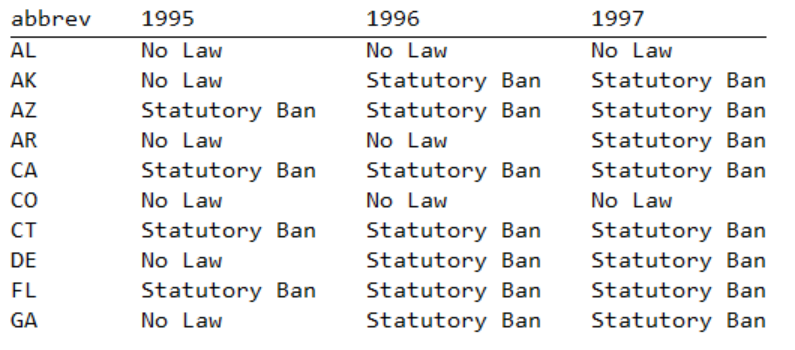
The data presented for this month's challenge is basically the status of same-sex marriage by state on a given year. A sample of the table is shown here.
data = Import[
   "https://raw.githubusercontent.com/zonination/samesmarriage/master/\
ssm.csv", "Data"];
title = First@data; data = Rest@data;
data[[All, 1]] = Interpreter["AdministrativeDivision"][data[[All, 1]]]
TableForm[data[[;; 10, 2 ;; 5]],
 TableHeadings -> {None, title[[2 ;; 5]]}]
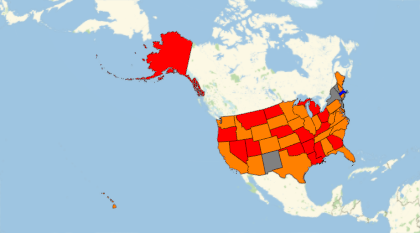
The main issue for presenting this data with the geographic visualization functions is that the states of Alaska and Hawaii are far from the rest of the contiguous US states. status = data[[All, 3 ;;]] // Flatten // Union rulesNumeric = Thread[Rule[status, {2, 3, 0, 1}]]; ({"Constitutional Ban" -> 3, "Legal" -> 4, "No Law" -> 1, "Statutory Ban" -> 2}) GeoRegionValuePlot[ Transpose[{data[[All, 1]], data[[All, 12]] /. rulesNumeric}], ColorRules -> {1 -> Gray, 2 -> Orange, 3 -> Red, 4 -> Blue}]
A useful US Chloropleth graphing function would be a great add-on to the Wolfram Language. Let's start creating the building blocks for such a function in this posting. The actual creation of a package would be left as a challenge for whoever wants to take it.
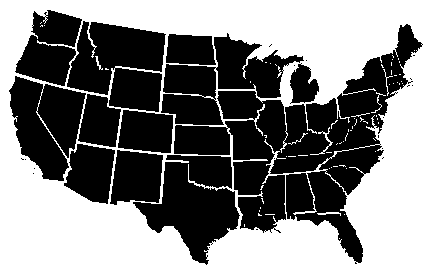
contiguousStates = Complement[ EntityClass["AdministrativeDivision", "AllUSStatesPlusDC"] //  EntityList, {Entity["AdministrativeDivision", {"Alaska", "UnitedStates"}],
   Entity["AdministrativeDivision", {"Hawaii", "UnitedStates"}]}];
polys = First@Cases[GeoListPlot[#, GeoRange -> Entity["Country", "UnitedStates"], GeoBackground -> None], _Polygon,Infinity]&/@contiguousStates;
Graphics[polys]

Let's rescale the states so as to separate each one and make them more visible.
rescale[polygon_, scale_] :=  Module[{centroid = RegionCentroid[polygon]}, TransformedRegion[polygon, ScalingTransform[scale, centroid]]]
contiguousStatesRescale = rescale[#, {0.95, 0.95}] & /@ polys;
Graphics[contiguousStatesRescale]
Let's add the shape files for Alaska and Hawaii and rescale and recenter in the US chart.
rescaleTranslate[polygon_, scale_, center_] :=
 Module[{centroid = RegionCentroid[polygon]},
  TransformedRegion[rescale[polygon, scale],
   TranslationTransform[center - centroid]]]
alaska = First@Rest[Cases[GeoListPlot[Entity["AdministrativeDivision", {"Alaska", "UnitedStates"}],
          GeoBackground -> None], _Polygon, Infinity]];
hawaii = First@Cases[GeoListPlot[Entity["AdministrativeDivision", {"Hawaii", "UnitedStates"}],
     GeoBackground -> None], _Polygon, Infinity];
centerHawaii = {-.14, -.18};
Graphics[{rescaleTranslate[hawaii, {0.01, 0.01}, centerHawaii], contiguousStatesRescale}]

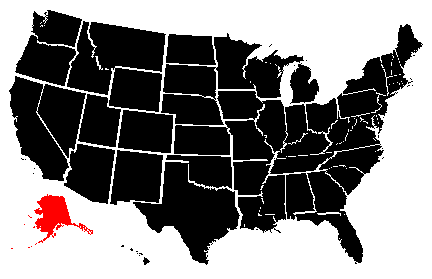
Let's do the same for Alaska
centroidAlaska = Mean[Cases[alaska, {_, _}, Infinity]];
centerAlaska = {-.282, -.13};
Graphics[{rescaleTranslate[hawaii, {0.01, 0.01}, centerHawaii],
  contiguousStatesRescale, Red,
  TransformedRegion[
   TransformedRegion[alaska,
    ScalingTransform[{0.3, 0.3}, centroidAlaska]],
   TranslationTransform[centerAlaska - centroidAlaska]]}]
alaskaTransformed =
TransformedRegion[
TransformedRegion[alaska,
ScalingTransform[{0.3, 0.3}, centroidAlaska]],
TranslationTransform[centerAlaska - centroidAlaska]];
hawaiiTransformed =
rescaleTranslate[hawaii, {0.01, 0.01}, centerHawaii];
states = Join[
contiguousStates, {Entity[
"AdministrativeDivision", {"Alaska", "UnitedStates"}],
Entity["AdministrativeDivision", {"Hawaii", "UnitedStates"}]}];
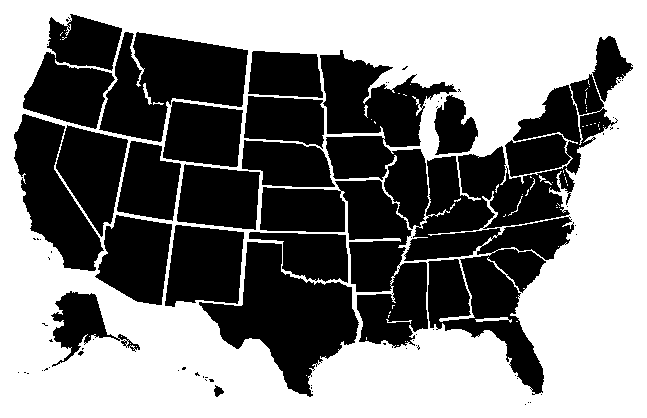
polygons =
Join[contiguousStatesRescale, {alaskaTransformed,
hawaiiTransformed}];
Graphics[polygons]
rulesStates = Thread[Rule[states, polygons]];
rulesStatus = Thread[Rule[status, {Red, Blue, Gray, Orange}]];
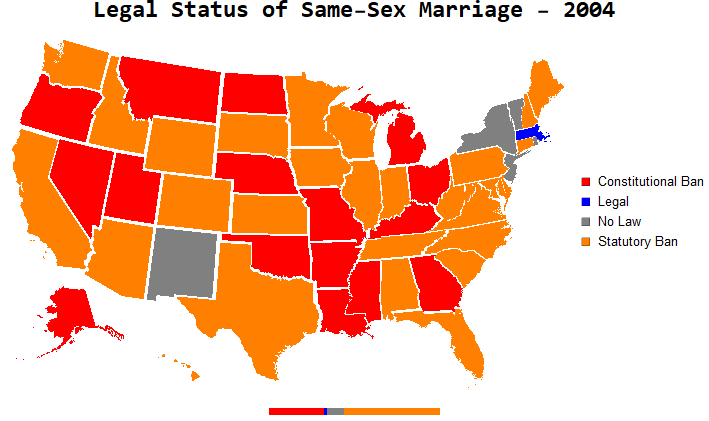
Export["samesex.gif",
Table[With[{o2 =
Graphics[
With[{sortedData = (data[[All, j]] // Sort) /. rulesStatus},
Table[{sortedData[[i]], Rectangle[{i - 1, 0}, {i, 2}]}, {i,
50}]]],
o = Graphics[
Transpose[{data[[All, j]] /. rulesStatus,
data[[All, 1]] /. rulesStates}], ImageSize -> Large]},
Column[{Style[
"Legal Status of Same-Sex Marriage - " <> ToString[title[[j]]],
Bold, Large],
Row[{o, SwatchLegend[rulesStatus[[All, 2]],
rulesStatus[[All, 1]]]}], o2}, Alignment -> Center]], {j, 3,
Length@title}], "DisplayDurations" -> Range[Length[title] - 2]/5]