Caught
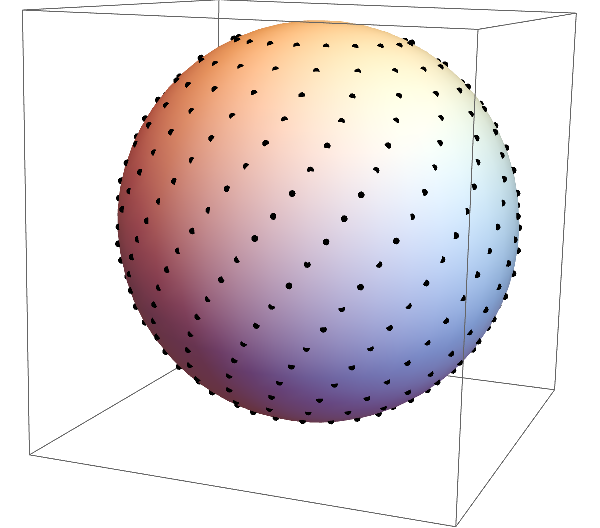
Continuing with the stereographic projection theme. This time, I generated a bunch of points arranged in spirals on the sphere, like so:

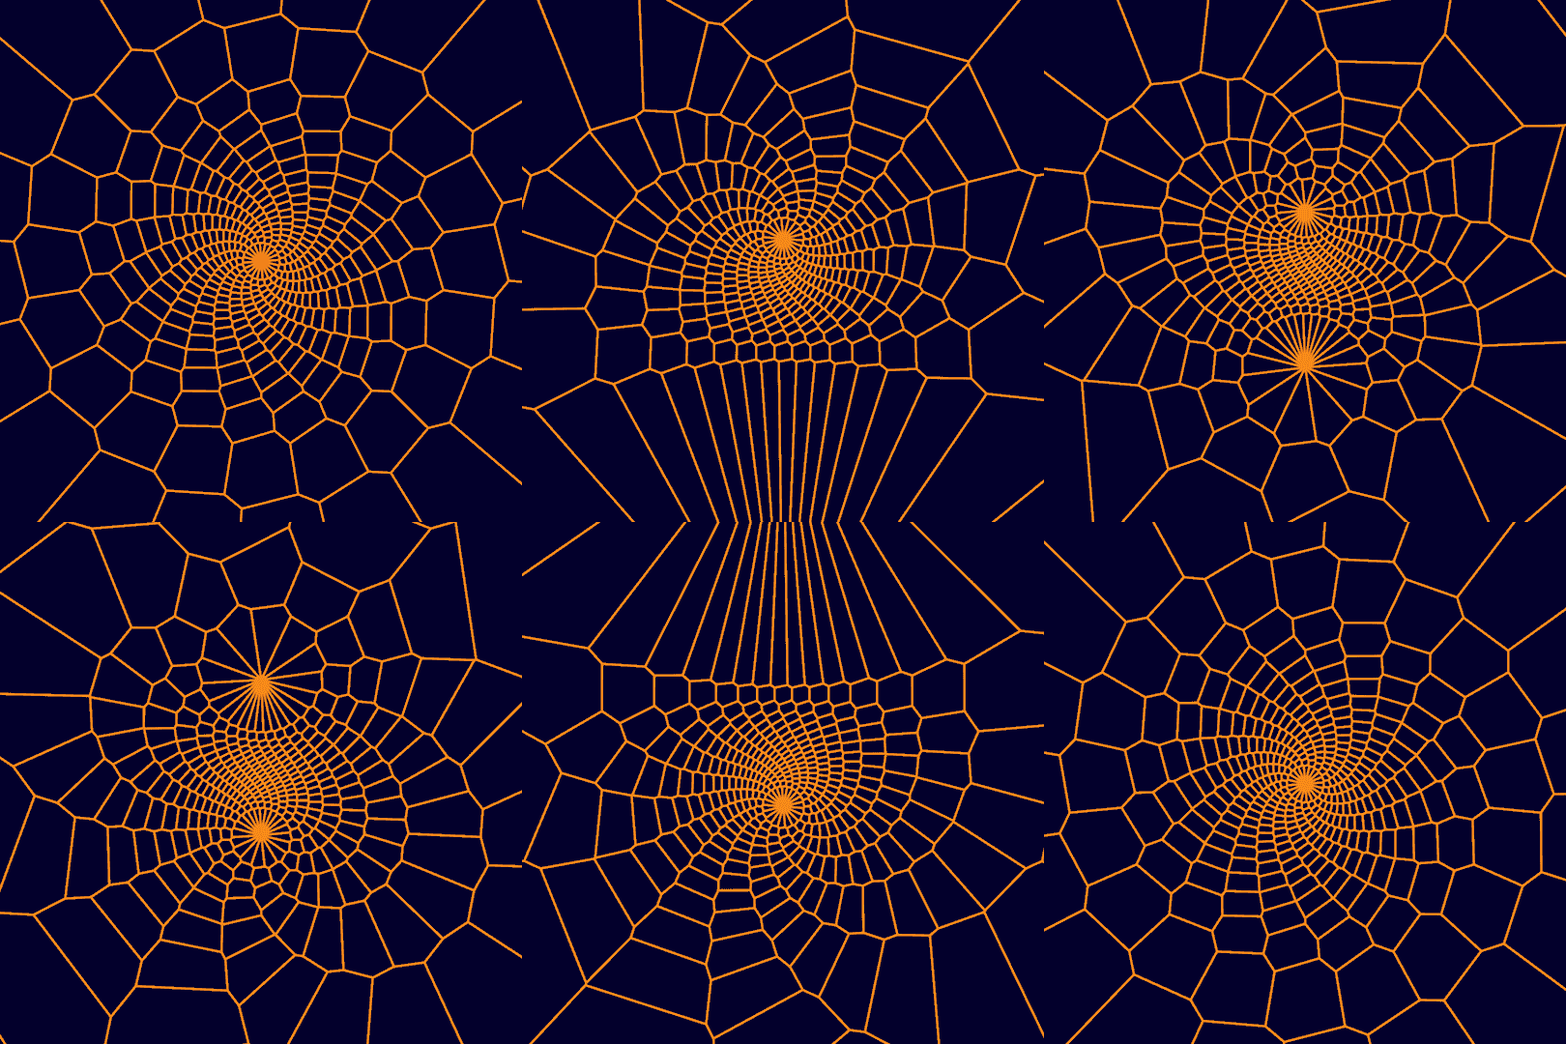
Then I stereographically project the points to the plane and compute the Voronoi diagram of the resulting points. Throw in a rotation of the sphere and you get the above animation.
As for the code, first of all we need the stereographic projection map:
Stereo[p_] := p[[;; -2]]/(1 - p[[-1]])
Next, we need to define the points. It turned out that without throwing in some noise in the definition of the points, VoronoiMesh[] would occasionally fail, which is why I put in the RandomVariate[] business in both cylindrical coordinates:
pts = With[{n = 20},
   Table[
    CoordinateTransformData["Cylindrical" -> "Cartesian", "Mapping"]
     [{Sqrt[1 - (z + #)^2], ? + RandomVariate[UniformDistribution[{-.00001, .00001}]]
         + (z + # + 2)/2 * ?/2, z + #}
       &[RandomVariate[UniformDistribution[{-.00001, .00001}]]]
     ],
    {z, -.9, .9, 2/n}, {?, 0, 2 ? - 2 ?/n, 2 ?/n}]
   ];
Finally, then, here's the animation:
With[{cols = RGBColor /@ {"#F5841A", "#03002C"}},
 Manipulate[
  VoronoiMesh[
   Stereo[RotationMatrix[?, {1., 0, 0}].#] & /@ Flatten[pts, 1],
   {{-4.1, 4.1}, {-4.1, 4.1}}, PlotTheme -> "Lines", PlotRange -> 4,
   MeshCellStyle -> {{1, All} -> Directive[Thickness[.005], cols[[1]]]},
   ImageSize -> 540, Background -> cols[[-1]]],
  {?, 0, ?}
  ]
 ]