Message Boards Message Boards

0
|
2590 Views
|
4 Replies
|
4 Total Likes
View groups...
Share
Share this post:

[?] Plot a 2D Graph with two variables?

Posted 6 years ago

sin2xcos²t where x has 3 values [?/4,?/6,?/12,] and t ranges from 0 to 3. The graph which is required is attached below.

Attachments:
4 Replies
Plot[Sin[2 \[Pi] {1/4, 1/6, 1/12}] Cos[t]^2, {t, 0, 3}]
POSTED BY: Frank Kampas
 $Version
 (* 11.3.0 for Microsoft Windows (64-bit) (March 7, 2018) *)

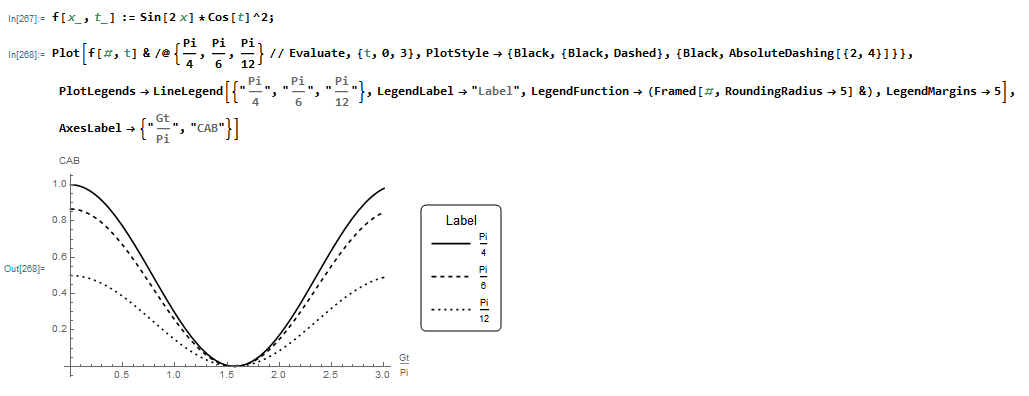
 f[x_, t_] := Sin[2 x]*Cos[t]^2;

 Plot[f[#, t] & /@ {Pi/4, Pi/6, Pi/12} // Evaluate, {t, 0, 3}, PlotStyle -> {Black, {Black, Dashed}, {Black, 
 AbsoluteDashing[{2, 4}]}}, PlotLegends -> LineLegend[{"\!\(\*FractionBox[\(Pi\), \(4\)]\)", "\!\(\*FractionBox[\(Pi\), \(6\)]\)", 
 "\!\(\*FractionBox[\(Pi\), \(12\)]\)"}, LegendLabel -> "Label", LegendFunction -> (Framed[#, RoundingRadius -> 5] &), 
 LegendMargins -> 5], AxesLabel -> {"\!\(\*FractionBox[\(Gt\), \(Pi\)]\)", "CAB"}]

. enter image description here

Regards,MI

POSTED BY: Mariusz Iwaniuk

Thank you very much for your kind reply sir.

Thank you very much for your kind reply sir.You have really explained with details.

Reply to this discussion
Community posts can be styled and formatted using the Markdown syntax.
Reply Preview
Attachments
Remove
or Discard

Group Abstract Group Abstract