Line-following is an important feature in many robots used in industry and education; in such a robot, it is critical that the robot follows a particular path as defined. It is reasonably easy to program a line-following robot and make it follow a line, but the process of properly tuning such a robot using a PID algorithm for accurately following a line, without jerks, is a time-consuming task, requiring trial and error. Also, it is not possible to determine the path followed by the robot, its average speed and the distance traveled by the robot via the robot's controlling software, a feature that would be very useful to figure out if the robot's program is efficient and accurate.
In this project, a line-following LEGO EV3 robot (retail version) using a PID algorithm has been interfaced with Mathematica via Bluetooth and real-time data obtained from various sensors of the robot has also been analyzed. It may be pointed out that while LEGO does provide the sensor data plotting software via the more expensive EV3 Educational version, it does not provide any feature of analyzing/fitting the data in its software; consequently, Mathematica is much more versatile and superior for the purposes of real time data analysis.
The studies carried out included the following:
- Data from both the EV3 motor rotation sensors was plotted versus time; this was thereafter used to measure the approximate distance traveled by the robot along various segments of the defined path.
- Data from the EV3 Gyro sensor, purchased separately, was also plotted versus time and the data filtered using Mathematica to obtain the angular turns taken by the robot along the path.
The above data sets were then analyzed in Mathematica to generate the approximate path traveled by the robot, and also determine its average speed and distance traveled.
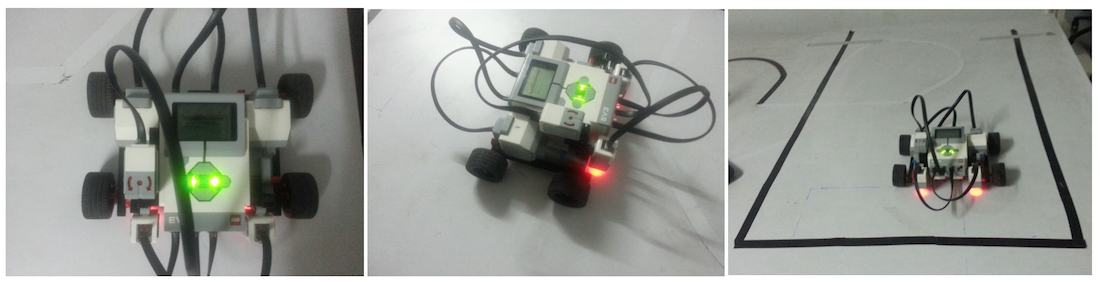
ROBOT DETAILS AND OPERATION
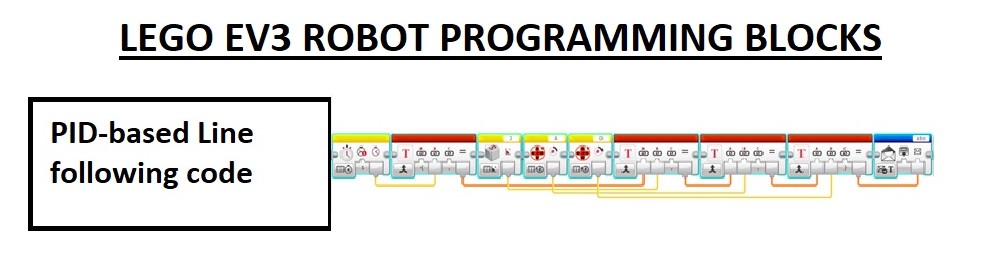
The robot consisted of two color sensors (one color sensor purchased additionally) measuring reflected light intensity, one gyro sensor measuring the angle of rotation of the robot and two large motors with built-in encoders. The block diagram of the code is as follows:
The step-wise operation involved:
Connecting the Robot to Mathematica via a Bluetooth connection. For this, Bluetooth needed to be enabled on the EV3 brick. If using Bluetooth for programming the EV3 in its software, the brick needed to be disconnected from the EV3 programming software prior to connecting with Mathematica.
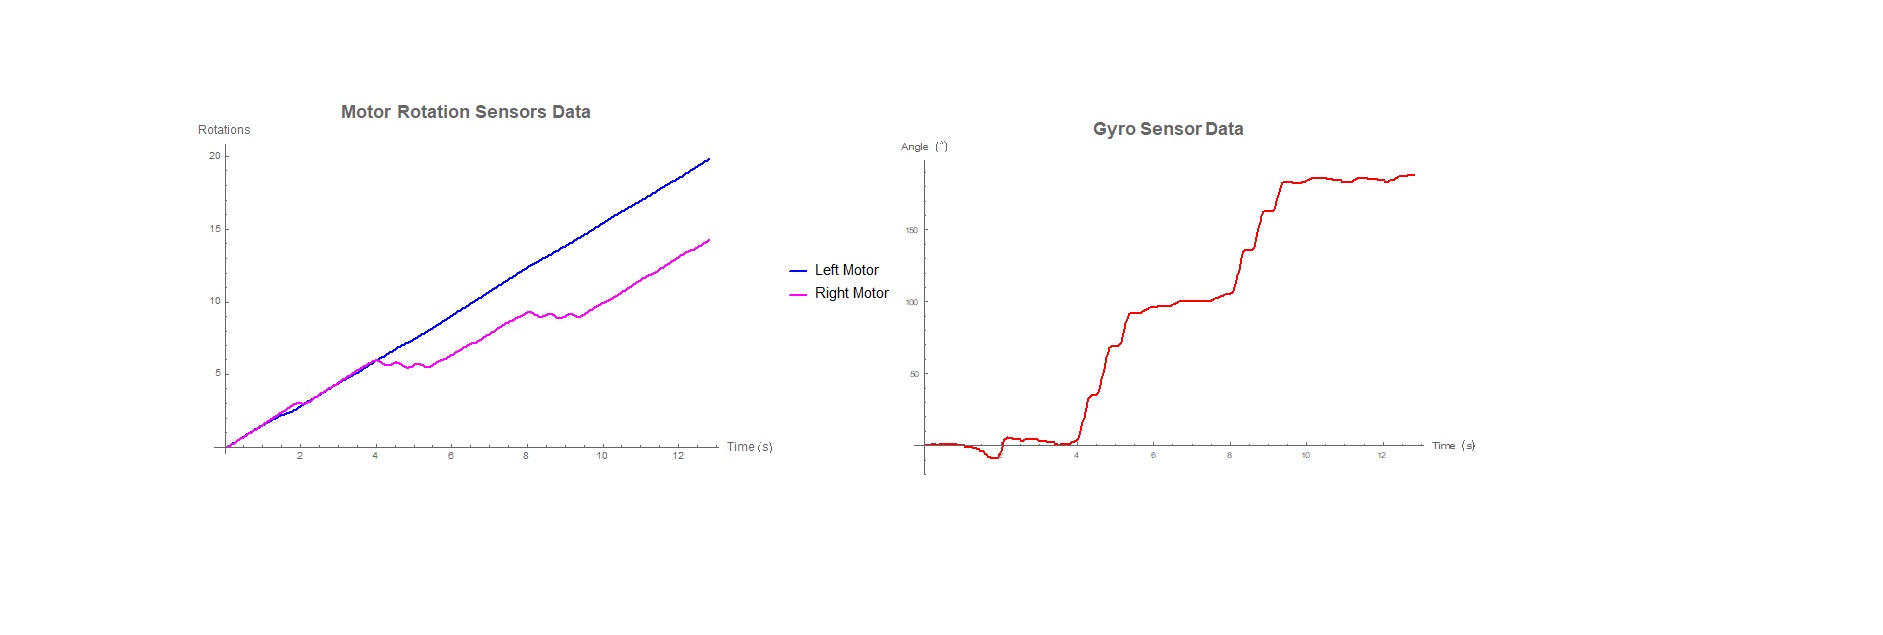
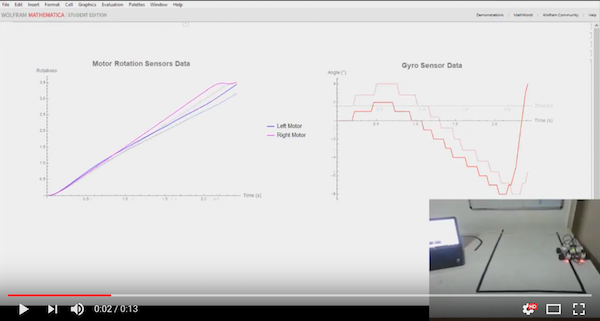
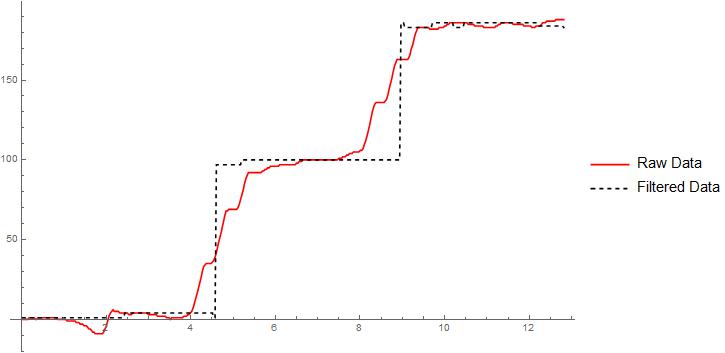
Obtaining real-time data: Real time data from the EV3 motor rotation sensors and the gyro sensor, respectively, was plotted in a separate notebook in Mathematica, as shown in the image below:
The YouTube video of the above can be accessed here or click on image:
From the image, the following can be easily inferred:
The right motor reverses in three stages each time the robot takes a 90-degree (right) turn. The left motor continues to rotate in the forward direction. This is as per the programming done in the robot.
Because of the above reason, the gyro sensor progressively increases its readings whenever the robot takes a 90 deg turn.
The reverse would happen if the robot were to take left turns.
Of course, real-time sensor data of the color sensors can also be plotted simultaneously as the line-following robot traverses its path; this was in fact initially done to confirm the reflected light intensity values from these sensors, respectively, to check the behavior of the sensors along the entire length of the path. Additionally, real time data from any other EV3 sensor(s) as well, if present, can also be plotted simultaneously in Mathematica as a function of time using the timer(s) provided in the EV3 brick.
POST PROCESSING ANALYSIS
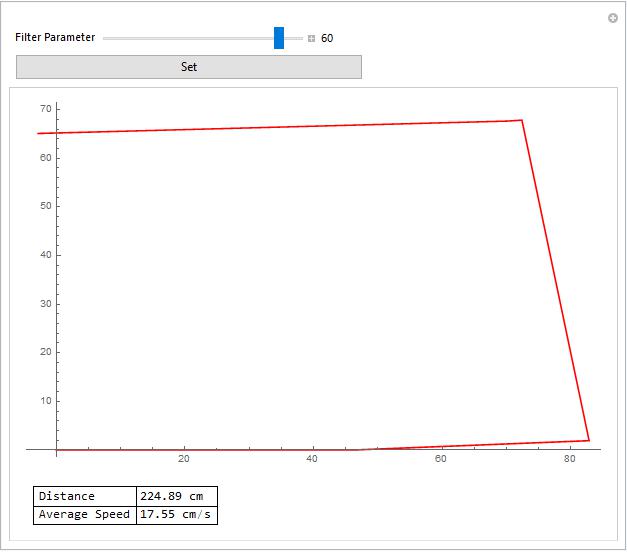
Once the robot traverses the entire path, the entire data sets received in Mathematica can be processed suitably for generating the required results. For example, in this case, the approximate path traversed by the robot, the distance traveled and the robots average speed were determined via Mathematica primarily using the following functions (a) CommonestFilter and (b) AnglePath. For path generation, the filter parameter was optimized to ensure that the path generated was almost identical to the traversed path; this step was necessary due to the fact that the sensor data is inevitably noisy and/or the robot could drift slightly as the color sensors are mounted almost 10 cm apart.
The results are shown in the following images:
CODE FOR DYNAMICALLY GRAPHING SENSOR DATA
The following code is required for connecting the robot with Mathematica and the function returns the sensor data:
s1 = DeviceOpen["Serial", "COM4"];
GetLegoSensorData[] :=
 Module[{in, l, p, j},
  in = Flatten[
    ToExpression[
     DeleteCases[
      StringCases[
       StringSplit[FromCharacterCode@DeviceReadBuffer[s1], "abc"],
       "{" ~~ __ ~~ "}"], {}]], 1];
  sortedIn =
   MapThread[List, {in[[All, 1]], in[[All, #]]}] & /@ Range[2, 4];
  {l, p, j} = sortedIn[[#]] & /@ Range[3]]
The following code is used for plotting the real-time data:
Clear[G2, MA, MD, InData]; MA = {}; MD = {}; G2 = {};
CreateDocument[{"", "", "", "",
  Dynamic[InData = GetLegoSensorData[]; AppendTo[G2, InData[[1]]];
   AppendTo[MA, InData[[2]]]; AppendTo[MD, InData[[3]]];
   Row@Riffle[({ListLinePlot[Flatten[#, 1] & /@ {MA, MD},
        ImageSize -> Large, PlotStyle -> {Blue, Magenta},
        PlotLegends -> {Style["Left Motor", 15],
          Style["Right Motor", 15]},
        PlotLabel -> Style["Motor Rotation Sensors Data", 18, Bold],
        AxesLabel -> {Style["Time (s)", 12], Style["Rotations", 12]}],
        ListLinePlot[
        Flatten[{First[#],
            Mod[Last[#],
             If[Last[#] == 0, 360, Sign[Last[#]]*360]]} & /@
          Flatten[G2, 1], 0], PlotStyle -> Red,
        AxesLabel -> {Style["Time (s)", 12],
          Style["Angle (\[Degree])", 12]}, ImageSize -> Large,
        PlotLabel -> Style["Gyro Sensor Data", 18, Bold]]}),
     Spacer[50]]]}, TextAlignment -> Center, Background -> White,
 WindowSize -> Large]
CONCLUSION
This project specifically highlights the advantages of using Wolfram Mathematica for acquiring and analyzing real time data from various sensors of a line-following LEGO EV3 robot wirelessly using Bluetooth connectivity. Amongst the important results generated are the approximate path traversed by the robot, the distance travelled by the robot and its average speed. For information, the actual distance of the path, as measured using a measuring tape, was 218 cm.


