On April 8, Aubrey de Grey posted the paper "The chromatic number of the plane is at least 5" on arxiv.org.
This tackles the long unsolved Hadwiger-Nelson Problem, where the plane is colored with the minimum colors so that no two points are a unit distance apart. There are many unit distance 4-chromatic graphs known, such as the Golomb Graph (below), Moser Spindle, and Braced square. With these graphs you need at least 4 colors to avoid vertices of the same color being joined by an edge. With these, the chromatic number of the plane is at least 4.
The hexagonal grid can color the plane with 7 colors so that no two points are distance 1 apart. For decades, the chromatic number has been known to be one of the values 4, 5, 6, or 7. A few months ago, Aubrey contacted me due to my Demonstration Moser Spindles, Golomb Graphs and Root 33, where I built up a large dense graph filled with many overlapping 4-chromatic graphs.
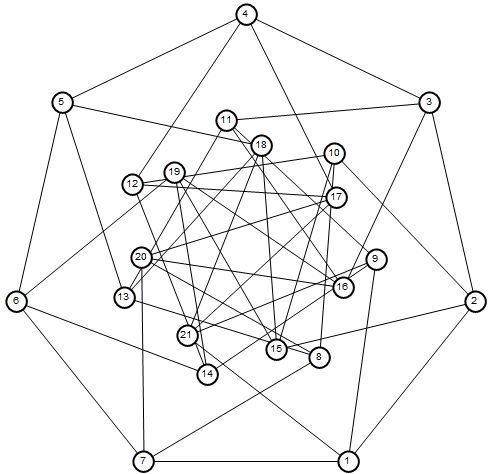
I've also found a new graphs on my own. Here's one I call the Nested-7 graph, which might be the smallest unit-distance 4-chromatic graph without a 4-cycle.
points=Flatten[Table[RootReduce[#.RotationMatrix[{0,-1,1}[[n]]Pi/21]&/@(CirclePoints[7]/ EuclideanDistance[{0,1},CirclePoints[7][[4+n]]])],{n,1,3}],1];
unitlines=Select[Subsets[Range[21],{2}],Chop[N[1-Quiet@EuclideanDistance@@points[[#]]]]==0&];
Graphics[{EdgeForm[{Black,Thick}],Line[points[[#]]]&/@unitlines,White, Disk[#,.05]&/@points,Black, Table[Style[Text[n,points[[n]]],10],{n,1,Length[points]}]}, ImageSize-> 500]
Aubrey had a Mathematica program for coloring a graph, and wondered if I could help him in his search. A few weeks ago, he found a unit-distance graph that seemed to need 5 colors. See the attached notebook.
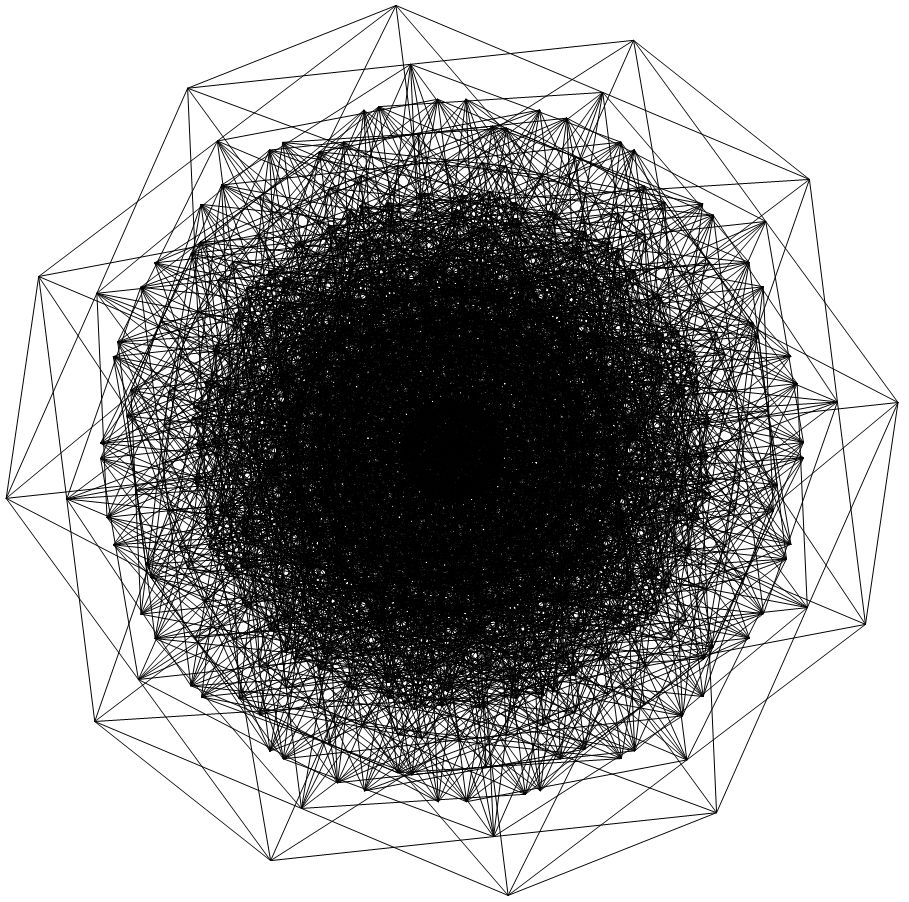
Length /@ {v, e}
The graph has 1585 vertices and 7909 edges. It's a big one. Here are a few set up items, and then a graphic. We could definitely just draw the graph, but that many points and lines is hard to visually analyze.
hexgrids = {{1, 2, 3, 10, 45, 74, 75, 111, 140, 141, 148, 206, 207, 214, 249, 278, 279, 338, 339},
   {1, 398, 399, 406, 441, 470, 471, 507, 536, 537, 544, 602, 603, 610, 645, 674, 675, 734, 735},
   {3, 794, 795, 802, 837, 866, 867, 903, 932, 933, 940, 998, 999, 1006, 1041, 1070, 1071, 1130, 1131},
   {794, 1190, 1191, 1198, 1233,1262, 1263, 1299, 1328, 1329, 1336, 1394, 1395, 1402, 1437, 1466,1467, 1526, 1527}};
importantedges = {{3, 399}, {3, 1191}, {75, 471}, {141, 537}, {207, 603}, {207, 999}, {279, 675}, {339, 735}, {867, 1263}, {933, 1329}, {999, 1395}, {1071, 1467}, {1131, 1527}};
importantvertices = {1, 3, 794};
colors = {Red, Green, Blue, Cyan, Gray};

Graphics[{Point[v],EdgeForm[Black],Thick,
Table[{colors[[n]],Line[v[[#]]]&/@Select[e,Length[Intersection[hexgrids[[n]],#]]==2&], Disk[v[[#]],.02]&/@hexgrids[[n]]},{n,1,4}],
colors[[5]],Line[v[[#]]]&/@importantedges,Black,Disk[v[[#]],.04]&/@importantvertices}]
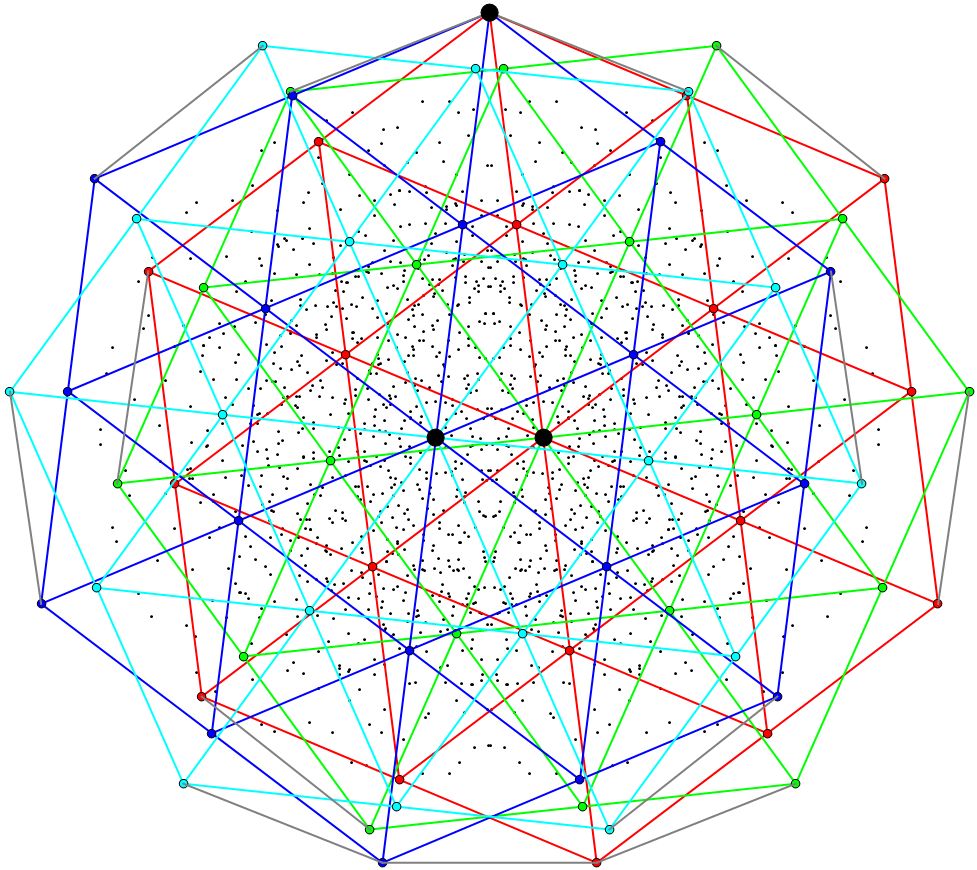
Basically, there are four triangle grids, which I've colored red, blue, green, and cyan. There are 13 important edges, which I've colored in gray, and three important vertices where the triangle grids overlap. Of the important edges, six connect cyan and blue, six connect red and green, and one at the bottom connects blue and red.
If these 73 vertices are removed, the remaining 1512 vertices split into four 378-vertex graphs that connect solely to one of the four triangular grids. The purpose of all these other vertices is to restrict the number of colorings
If vertex 3 and edge {207, 999} are removed, the graph splits in half. Add vertex 3 back in and the graph looks like the following.
Graphics[Line[v[[#]]] & /@ Intersection[e, Subsets[Sort[Append[First[ConnectedComponents[
        Graph[#[[1]] \[UndirectedEdge] #[[2]] & /@ Complement[Select[e, Not[MemberQ[#, 3]] &], {{207, 999}}]]]], 3]], {2}]]]
In this half graph, the 12 outer vertices have the property that any 4-coloring forces the opposing vertices to have the same color.
If the graph had a 4-coloring, the two bottom vertices would have the same color as the vertex at the top. But these two vertices are connected, so they cannot have the same color. Therefore, a 4-coloring doesn't exist.
There is now a polymath project for finding the smallest 5-chromatic unit-distance graph.
 Attachments:


