RMS Titanic sank from the night of 14 April through to the morning of 15 April 1912 in the North Atlantic Ocean, four days into the ship's maiden voyage from Southampton to New York City. The largest passenger liner in service at the time, Titanic had an estimated 2,224 people on board when she struck an iceberg at around 23:40 (ship's time) on Sunday, 14 April 1912. Her sinking two hours and forty minutes later at 02:20 (05:18 GMT) on Monday, 15 April resulted in the deaths of more than 1,500 people, which made it one of the deadliest peacetime maritime disasters in history. (Wikipedia)
In this post I will show how to predict the survival of Titanic passengers, create a timeline plot of the sinking, create the above word cloud and analyse the script of Titanic's movie.
Predict the survival of Titanic passengers
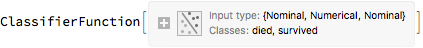
Following this tutorial we will train a classifier on the "Titanic" dataset (from the Wolfram Data Repository), which contains a list of Titanic passengers with their age, sex, ticket class, and survival.
classifier = Classify[ResourceData["Sample Data: Titanic Survival", "TrainingData"], Method -> "LogisticRegression"]
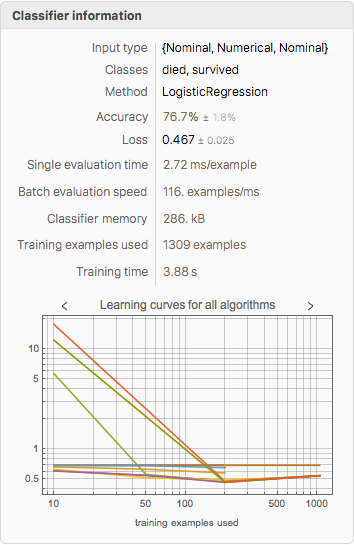
 We can obtain general information about the classifier:
ClassifierInformation[classifier]
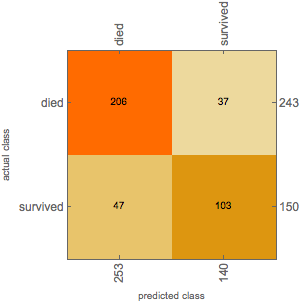
 And visualize the accuracy of the classifier on the test dataset:
ClassifierMeasurements[classifier, ResourceData["Sample Data: Titanic Survival", "TestData"], "ConfusionMatrixPlot"]
 Finally we can plot the survival probability of Titanic passengers as a function of their sex, age, and ticket class as follows:
p[class_, age_, sex_] :=
  classifier[{class, age, sex}, {"Probability", "survived"}];

Plot[{p["1st", x, "female"], p["2nd", x, "female"],
  p["3rd", x, "female"], p["1st", x, "male"], p["2nd", x, "male"],
  p["3rd", x, "male"]}, {x, 0, 85},
 PlotLegends -> {"female, 1st class", "female, 2nd class",
   "female, 3rd class", "male, 1st class", "male, 2nd class",
   "male, 3rd class"}, Frame -> True,
 FrameLabel -> {"Age (years)", "Survival probability"}]
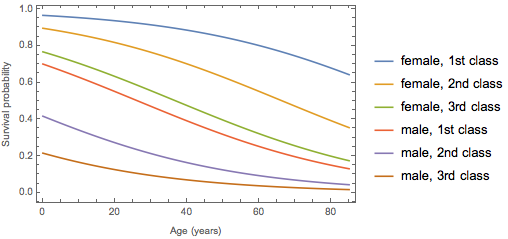
If you were an adult male and poor your chances of surviving were really low.
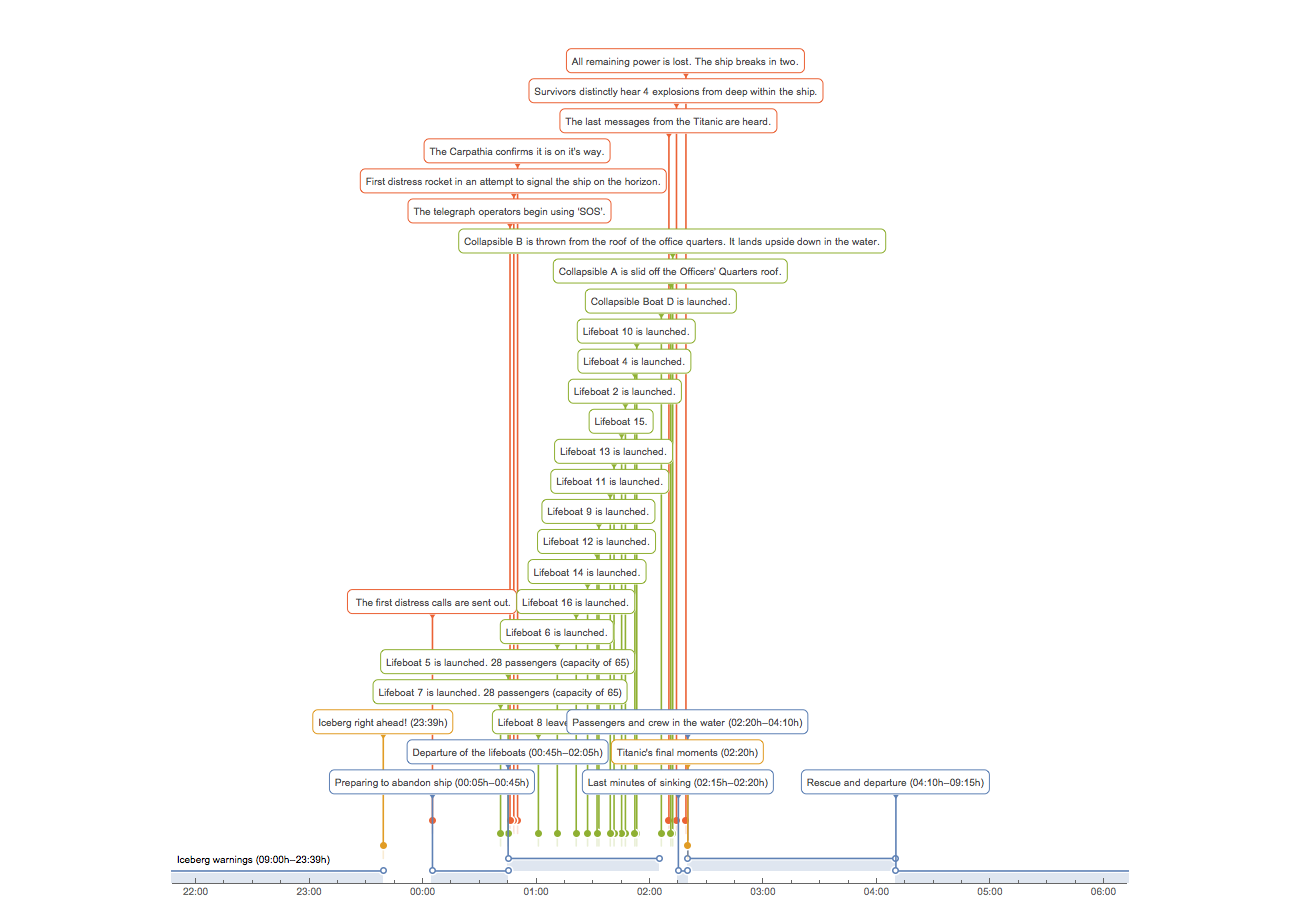
Create TimelinePlot of Titanic's sinking
There is even a Wikipedia entry on Titanic's sinking, which orders chronologically events that happen during the catastrophe. Using the TimelinePlot we can create the following plot:
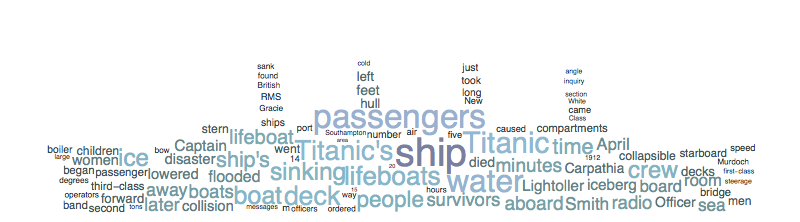
Create a WordCloud with Titanic's shape
In order to create a WordCloud with Titanic's shape we need first to create a mask: 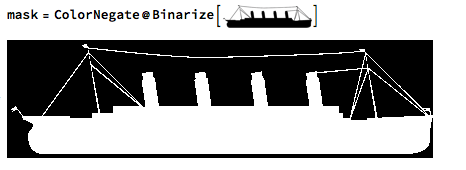
Then we obtain the text from Wikipedia's entry using WikipediaData:
wikiText = WikipediaData["Sinking_of_the_RMS_Titanic"];
Finally using DeleteStopwords and a ScalingFunctions to improve the looks of the WordCloud we obtain the following:
WordCloud[DeleteStopwords[wikiText],
 mask, ScalingFunctions -> (#^.1 &),
 ColorFunction -> ColorData["AtlanticColors"], ImageSize -> 800]
Visualize when Jack and Rose are playing an important role during Titanic's movie
Here I will focus on the script of "The Titanic Movie" (I got the script from the internet Movie Script Database (IMSDb)). We can use the SmoothHistogram in order to compute the probability density function of Jack and Rose over the movie and visualize when they are playing an important role.
str ="...script..." ;
partitions = StringSplit[srt, "\n"];
blocks = Flatten[Position[StringSplit[srt, "\n"], ""]];

script = Flatten[Table[Table[i, {i, blocks[[j]] + 3, blocks[[j + 1]] - 1}], {j, Length[blocks] - 1}]];
stringsrt = StringDelete[StringJoin[  Flatten[Map[partitions[[#]] &, script]]], {Shortest[ "[" ~~ x___ ~~ "]"]}];

SmoothHistogram[{Legended[
   First /@ StringPosition[ToLowerCase[stringsrt], "jack"],
   Style["Jack (Leonardo DiCaprio)", Bold, 14]],
  Legended[First /@ StringPosition[ToLowerCase[stringsrt], "rose"],
   Style["Rose (Kate Winslet)", Bold, 14]]},
 AxesLabel -> {Style["number of letters", Bold, 14],
   Style["probability density function", Bold, 14]}, Filling -> Axis,
 ImageSize -> Large]
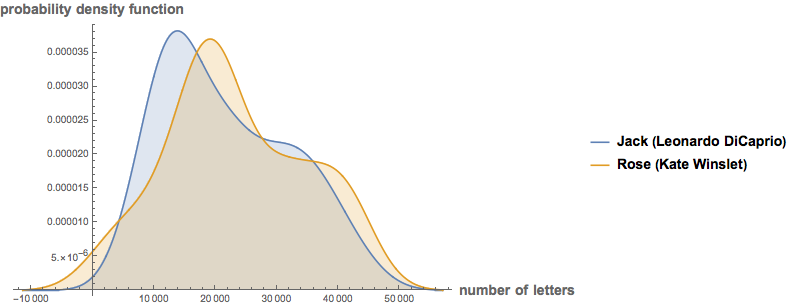
We can clearly see that in the middle of the movie they are sharing most of the scenes.
Hope you enjoyed this little exploration into the historical catastrophe and the convenience and versatility of using the Wolfram Language.
Other posts on Community using Titanic's datasets are the following:


