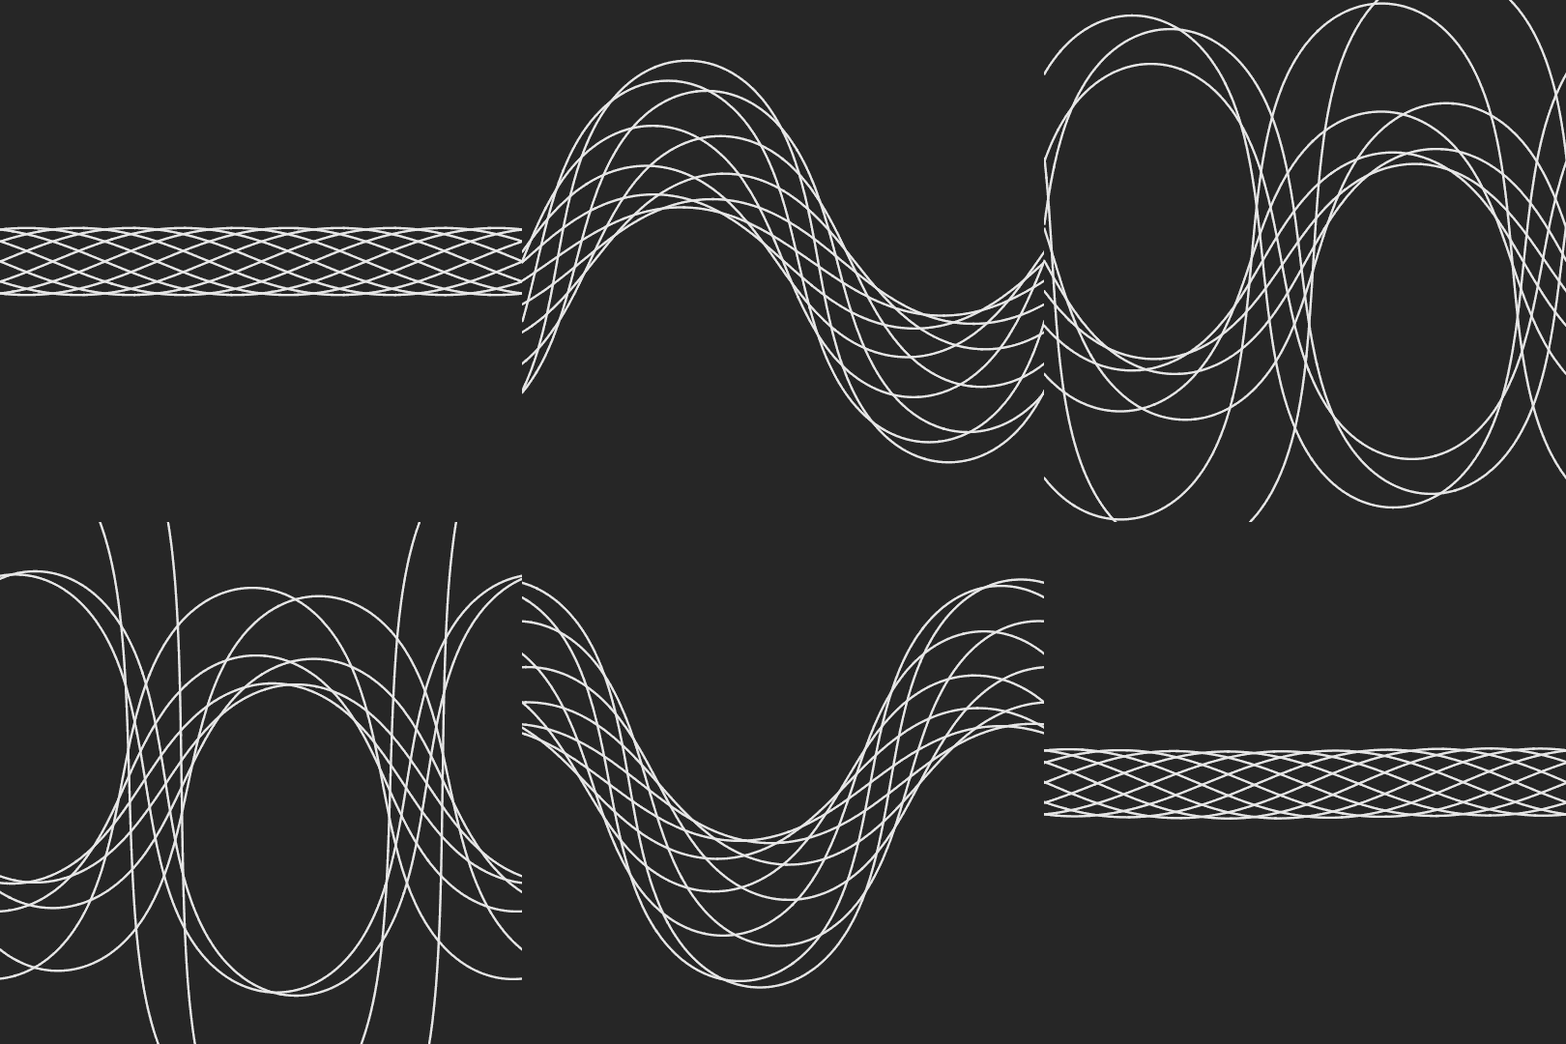
Map
I've really been enjoying what Roice Nelson has been doing lately with @TilingBot on Twitter, especially this Mercator projection, so I decided to play around a bit with Mercator projections.
First of all, it's natural to define the Mercator projection in terms of latitude and longitude, so here's a function to convert Cartesian coordinates to latitude-longitude coordinates:
LatLong[{x_, y_, z_}] := {ArcSin[z], ArcTan[x, y]};
If $\lambda$ denotes latitude and $\phi$ denotes longitude and we assume we're on a unit sphere, the Mercator projection is given by the map $(\phi, \lambda) \mapsto (\lambda, \ln(\tan(\pi/4+\phi/2)))$, which we can define:
Mercator[{?_, ?_}] := {?, Log[Tan[?/4 + ?/2]]};
To make the animation, I'm projecting the great circles which are perpendicular to ten equally-spaced points on the circle at $67.5^\circ$ north latitude, namely:
pts = Table[
   CoordinateTransform["Spherical" -> "Cartesian", {1, ?/8, ?}],
   {?, -? + ?/10., ? - ?/10, 2 ?/10}];
Now, I'm going to rotate the entire sphere around the axis $(1,1,1)$ and then take the Mercator projection of my great circles. To plot this, I'm going to use ParametricPlot[], so I need to parametrize each great circle. If $\{b_1, b_2\}$ is an orthonormal basis for the orthogonal complement of a point $p$ on the unit sphere, then $\cos t \, b_1 + \sin t \, b_2$ parametrizes the great circle orthogonal to $p$.
In order not to have weird discontinuities, I want to find an orthonormal basis for each perpendicular plane so that the first basis vector is perpendicular to the $x$-axis, which will make the longitude run from $-\pi$ to $\pi$ as $t$ runs from $-\pi$ to $\pi$:
bases = ParallelTable[
     1/Sqrt[#[[1]]^2 + #[[3]]^2]
        {Sign[#[[3]]] {#[[3]], 0, -#[[1]]},
         {#[[1]] #[[2]], -#[[1]]^2 - #[[3]]^2, #[[2]] #[[3]]}}
       & /@ (pts2.RotationMatrix[?, {1, 1, 1}]),
     {?, 0., 2 ? - #, #}] &[2 ?/300];
Finally, then, we just apply the Mercator projection and plot:
With[{cols = {GrayLevel[.9], GrayLevel[.15]}},
 Manipulate[
  ParametricPlot[
   Mercator[LatLong[Cos[t] #[[1]] + Sin[t] #[[2]]]] & /@ bases[[i]],
   {t, -?, ?}, PlotRange -> ?, ImageSize -> 540,
   Axes -> False, PlotStyle -> Directive[cols[[1]], Thickness[.0045]],
    Background -> cols[[-1]]],
  {i, 1, 300, 1}]
 ]
Of course, it would be nicer to think of each great circle as some region on the sphere with thickness, so that the projection has varying thickness (as in Roice's image), but I'm leaving that complication for another day.