Message Boards Message Boards

Plot a function within a circle, e.g. stresses within a loaded disk?

Posted 6 years ago

I wonder if anyone knows how to plot results within a circle, e.g. stresses and strains within a loaded disc?

POSTED BY: jiri havir
6 Replies
Posted 6 years ago

Thank you, it was helpfull

POSTED BY: jiri havir

Can be used

\[ScriptCapitalR] = ImplicitRegion[x^2 + y^2 <= a^2, {x, y}];
ContourPlot[
 TransformedField["Cylindrical" -> "Cartesian", 
   f, {r, \[Theta], \[Zeta]} -> {x, y, z}] /. 
  z -> z0, {x, y} \[Element] \[ScriptCapitalR]]

Well, sorry, I was assuming a little bit of creativity ... How about this:

f[r_, \[Phi]_] := Sin[10 r] Cos[\[Phi]]

ContourPlot[f[Sqrt[x^2 + y^2], ArcTan[x, y]], {x, y} \[Element] Disk[]]

By "... in a circle" I guess you mean inside a circle, i.e. on a Disk[]; this I had mentioned above.

POSTED BY: Henrik Schachner
Posted 6 years ago

Thanks, however what I am seeking for is a contour plot function in a circle. I have a solution function in polar coordinates for a loaded cylinders and want to plot the stress/strain distribution in the plane of the circular cross section of the cylinder. So I am not interested in 3D plots with out of plane displacements.

POSTED BY: jiri havir

You can use anything which represents a geometric region, e.g. Disk[], Ellipsoid[] or Polygon[]:

pts0 = {#1 - .5, #2 + Sqrt[3.]/2} & @@@ First[KochCurve[4]];
pts1 = DeleteDuplicates[Chop@Flatten[NestList[RotationTransform[-Pi/3], pts0, 5], 1]];
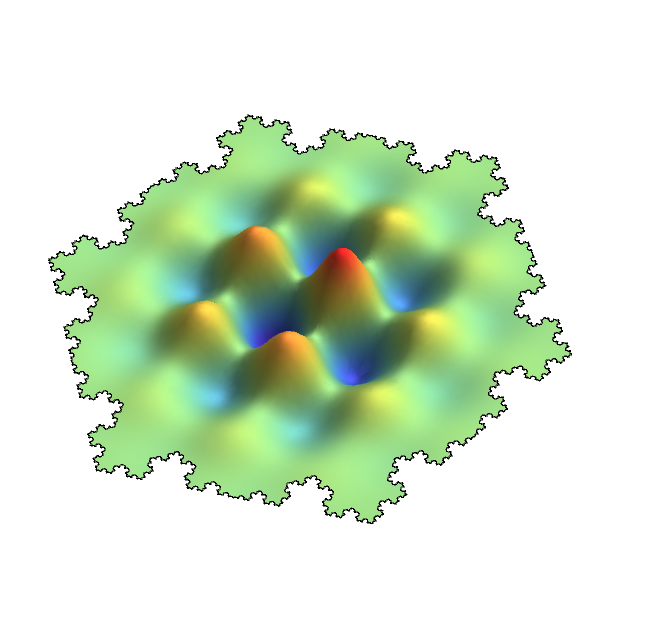
Plot3D[Sin[10 x] Cos[10 y] Exp[-4 (x^2 + y^2)], {x, y} \[Element] Polygon[pts1], PlotRange -> All, ColorFunction -> "Rainbow", Mesh -> None, ImageSize -> Large, PlotPoints -> 50, Boxed -> False, Axes -> False]

giving:

enter image description here

Regards -- Henrik

POSTED BY: Henrik Schachner

You might look at ContourPlot with the RegionFunction Option.

Reply to this discussion
Community posts can be styled and formatted using the Markdown syntax.
Reply Preview
Attachments
Remove
or Discard

Group Abstract Group Abstract