My goal is to curate the following data before I export it as a csv to open in Excel. I have downloaded financial data for more than one asset, like the following:
test2 = FinancialData[#, {{2000, 1, 1}, {2000, 1, 20}}] & /@ {"GS",
   "MS", "BAC"}
Step 1.
I would like to insert the asset's label to the start of each series, to read
{{GS, {{2000,1,3}, 88.313}, {{2000,1,4}, 82.75},...,
{{2000,1,20},85.938}},{MS,{{2000,1,3},56.0327},{{2000,1,4},51.8822},...,
{{2000,1,20},55.9555}},{BAC,{{2000,1,3},24.219},{{2000,1,4},22.782},...,{{2000,1,20},23.032}}}
I have tried to combine MapThread with Insert but nothing worked.
Step 2.
The second step is to organise the data in such a way that I can export it as a .csv to read like the following: 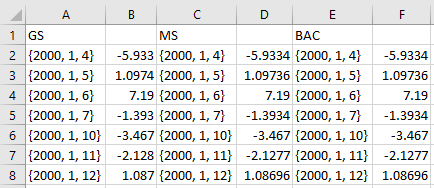
I can break apart dates and values by combining Flatten and Transpose, but all in two columns, as opposed to two columns for each asset (moreover, Transpose doesn't work when I add the assets' labels).
How to manipulate the data to look like the spreadsheet above when I export it?
Thanks


