Objective
Given sufficient amounts of text with the authors' information tagged, can we accurately produce a feature vector that describes the style of the author and represents a fingerprint of its style?
Abstract
Reuters 50/50 is a database of 5000 news articles written by 50 different authors. It serves as a baseline for authorship identification. Wolfram's standard Classify and FeatureExtraction functions were used on full articles, sentences and normalized sentences to generate a baseline dimension-reduced vector space. These results were compared with an ad-hoc neural network classifier using two different pre-trained neural networks: Glove-100 and ELMo Contextual as feature extractors, and further processing their output with various combinations of LSTM and GRU layers, and a vector space plot was created with much better results.
Data
Reuters 50/50 is a database of 5000 news articles written by 50 different authors broken down into two equal sets (training and validation). It serves as a baseline for authorship identification in many research fields.
Methodology
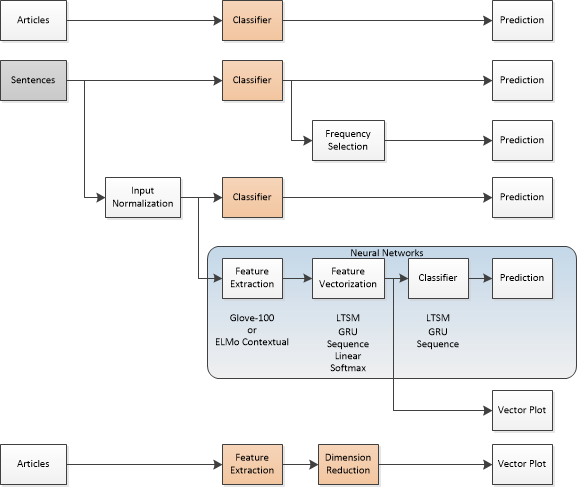
The figure below shows the different tests that were carried out during this work. A choice between using the full text form of the articles or using sentences was clear, and therefore both avenues were explored. Since the Classifier function in Wolfram is available, it was used to provide a baseline for classification. Also, the FeatureExtraction function was used to create a baseline vector field for all the articles. The prediction results of the 5 methods were compared. Since the objective was to generate a vector set, two methods were explored: using a neural network, and using a combination of feature extraction and dimension reduction, to produce a vector plot that would identify each article. What s sought is a clustering of articles for the same author in this reduced feature space.
Method Explorations
1. Feature Extraction on Articles
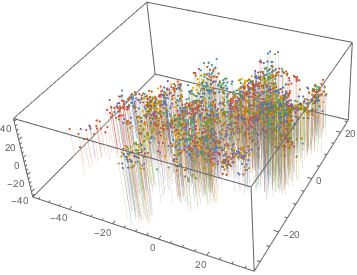
The full author articles were used to feed the FeatureExtraction function. As a result, a 14-dimension vector was obtained for each article. The ReduceDimension function was used to reduce the dimensions of the article space to three. The plot is shown below, where each author has a different color.
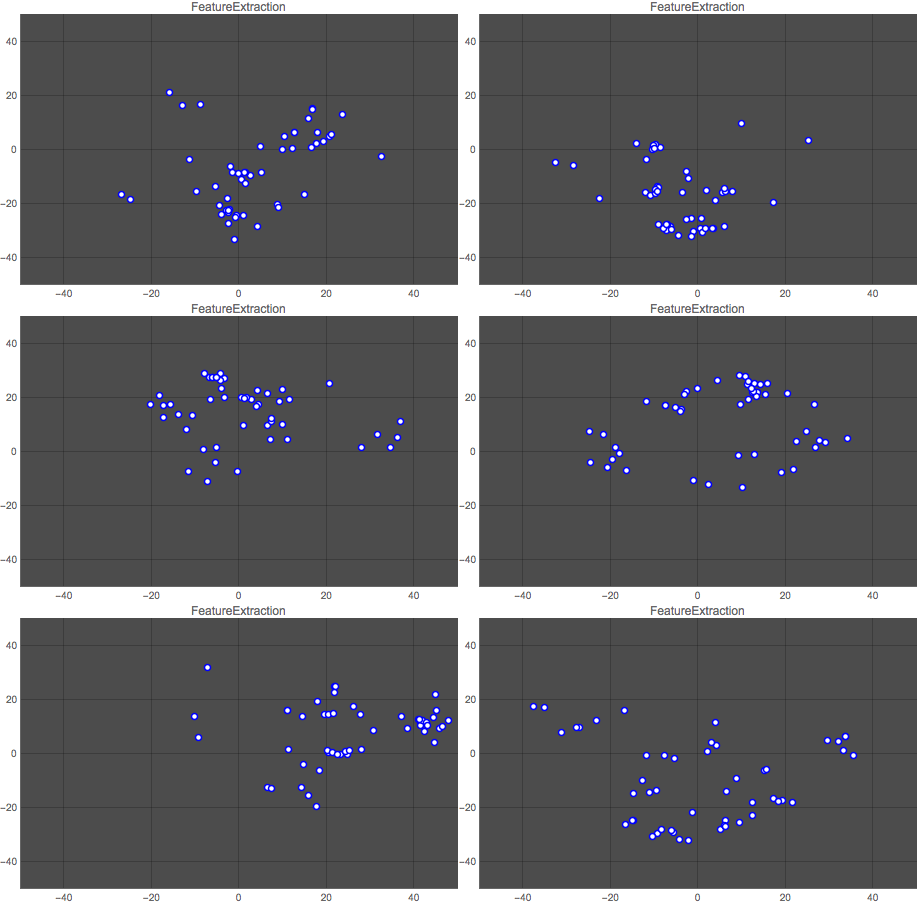
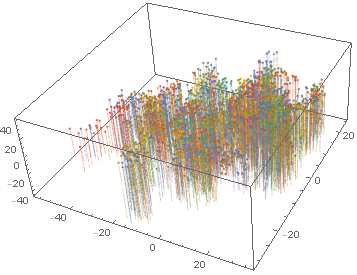 It is very hard to see if there are clusters that could indicate a particular author's style. However, when plotted separately by author, one can see that some authors indeed are classified in clusters, while others occupy a much larger space.
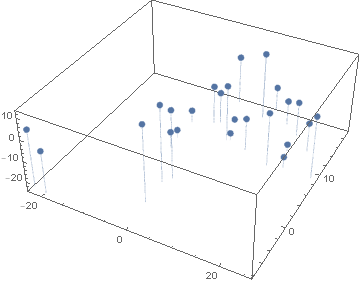
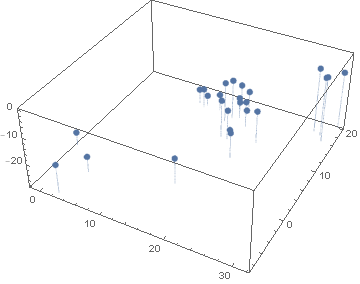
Feature extraction does give some measure of classification for authors' style but it is not a definite tool.
2. Classification using Full-text Articles
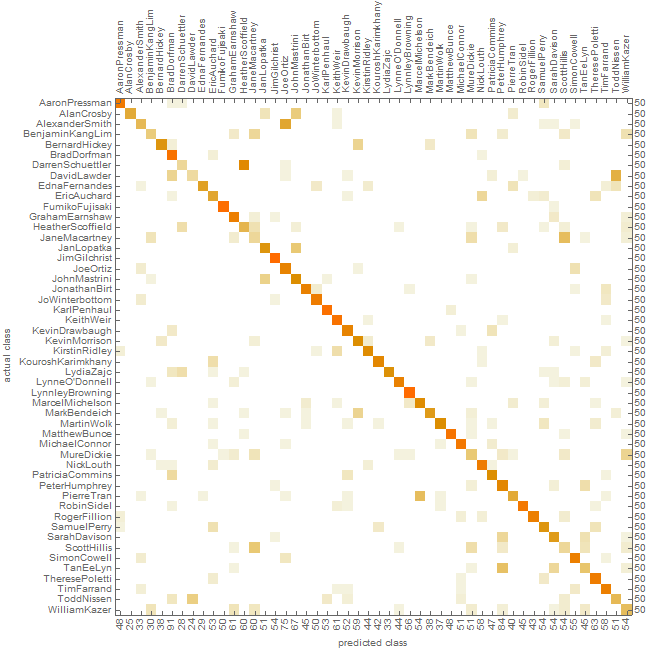
The Classify function was used with three different input data sets in order to determine if the classification accuracy improves from one to another. In the first case, Classify is used with the full-text articles for all the authors. The result is an accuracy of 66.4% in author identification. The ConfusionMatrixPlot is shown below:
3. Classification using Sentences
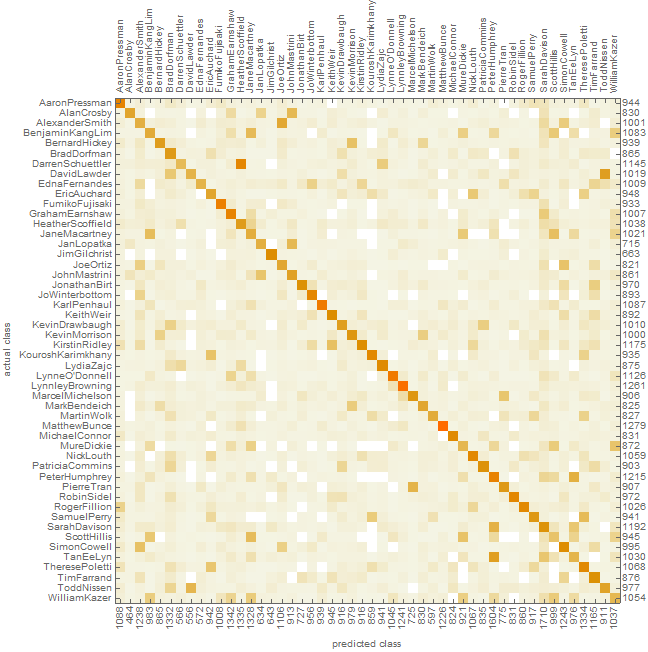
Each article was broken into its sentences and the resulting dataset was processed using the Classify function. The resulting accuracy was only 38.8%, and the resulting ConfusionMatrixPlot is shown below:
4. Classification using Sentences and Postprocessing with Stochastic Model
Each sentence in each article was marked with a unique identifier in order to reassemble the articles after classification. The resulting classified sentences were assembled back into articles keeping the prediction associated to each, and then feed a stochastic model in which the most frequent prediction was selected as the prediction for the article. The accuracy improves greatly, giving a total classification accuracy of 65.3%.
5. Classification using Normalized Sentences
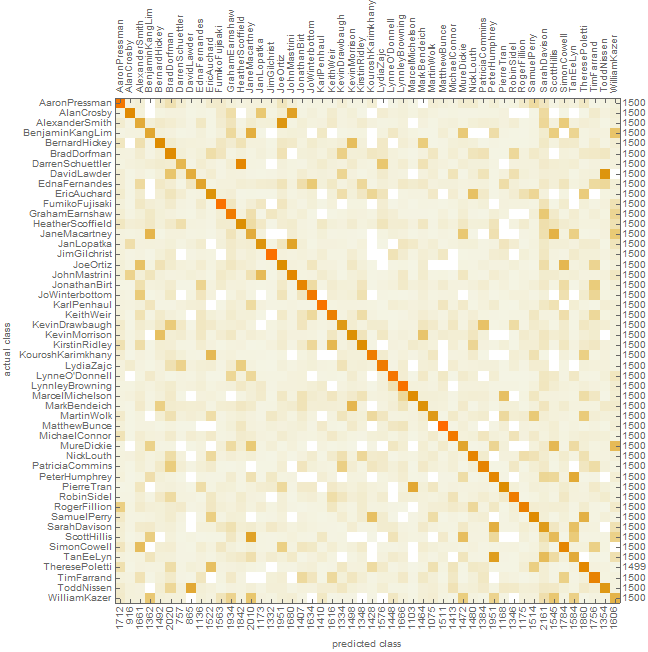
Since each article has a different number of sentences, padding was used by creating a new dataset made of a random sample of equal size for each author, with a size equal the largest number of sentences in an article. By normalizing the data the accuracy may have an improvement. The result of this method showed an accuracy of only 39.9% with a very slight improvement over the non-normalized method. The confusion matrix plot is shown below:
6. Classification using Neural Networks
Several network architectures and parameters were tried. The classifying network is a structure that contains: Feature Extraction --> Vectorization --> Classifier --> Prediction. As a Feature Extractor, two different configurations were used:
Using ELMo Contextual Word Representations Trained on 1B Word Benchmark, which is a classifier trained on 1 billion contextual words, or using Using GloVe 100 - Dimensional Word Vectors Trained on Wikipedia and Gigaword 5 Data, which is not contextual. The former is a much larger classifier, and the latter gave better training performance, and thus was selected hereinafter.
Both feature extractors were embedded, and once trained, their weights were frozen so that no further training would occur.
After the Feature Extraction layer, a combination of LongShortTermMemoryLayer (LSTM) and GatedRecurrentLayer (GRU) was used, and variations in the number of neurons in each layer were used. The combinations include the use of multiple layers of each type and different sequence order for them.
The networks were trained and the output layer would provide a class (one of 50 authors) and during the training both the loss function and the error were monitored for convergence between the test set and the evaluation set. Some of the networks were trained with a reduced set of inputs in order to determine convergence, others with the full data set, but none of them completed training.
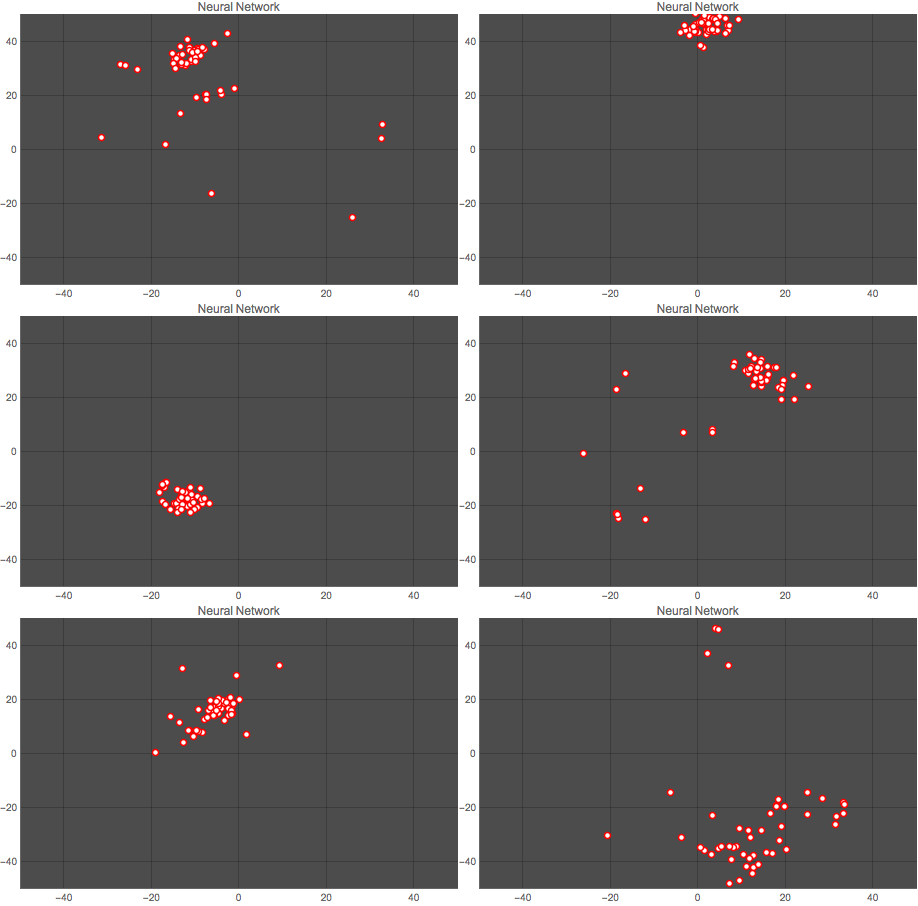
Here is a vector space classification which results in better clustering by using neural networks than the one using FeatureExtraction: 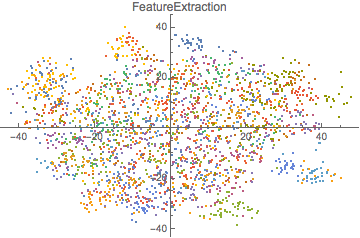
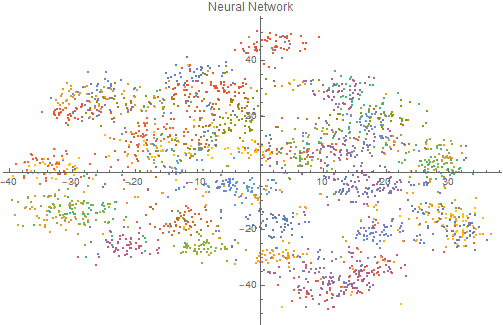 It is clear that using the FeatureExtraction function creates a vector space that is more uniform and does not show much clustering of the articles by the same author. The neural network, on the other hand, generates clusters for each author's articles and therefore is a much better feature detector.
Results
Here is a comparison of both methods. The first graph shows the vector space for one author (author No. 14) output by the Classify function, and the second graph shows the classification for the same author output by the neural network. Each point represents one article by the author. 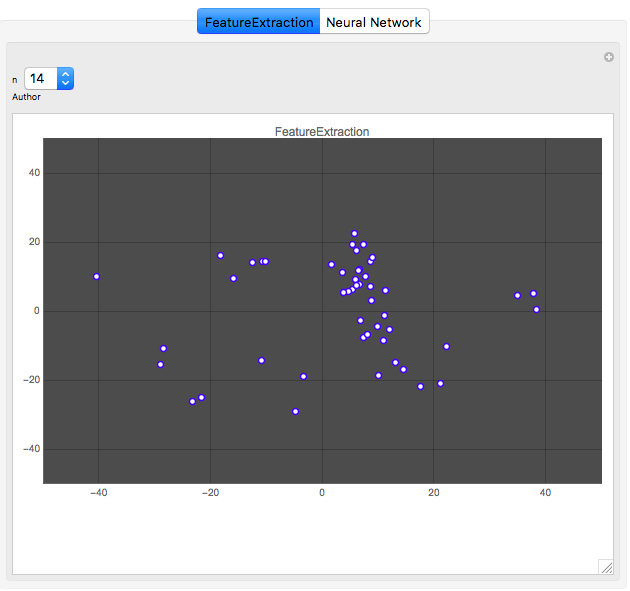
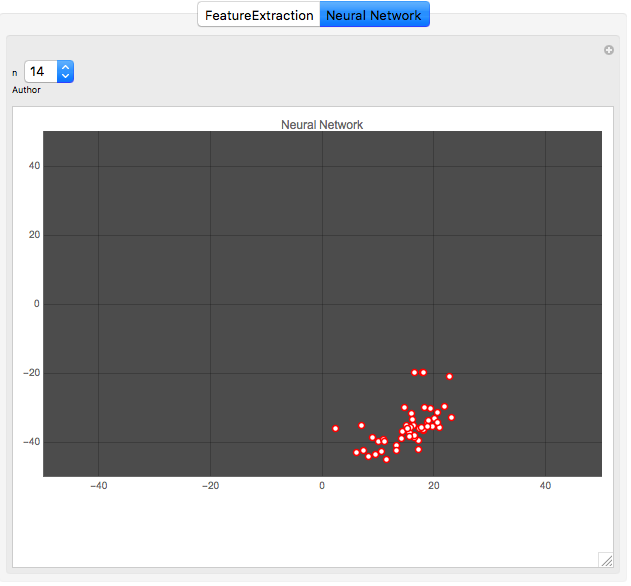
It is clear that the neural network does a better job at clustering the works by an author. This result is repeated for all authors, as the animation below shows:
Wolfram Language Code:
Data Preparation
text = Import["https://archive.ics.uci.edu/ml/machine-learning-databases/00217/C50.zip", "*.txt"];
directories = Map[DirectoryName, Import["https://archive.ics.uci.edu/ml/machine-learning-databases/00217/C50.zip"]];
authors = FileNameTake[#, -1] & /@ directories;
trainingText = text[[1 ;; 2500]];
trainingAuthors = authors[[1 ;; 2500]];
testText = text[[2501 ;;]];
testAuthors = authors[[2501 ;;]];
fullTrainingArticles = Thread[trainingText -> trainingAuthors];
fullTestArticles = Thread[testText -> testAuthors];
trainingTextSentences = TextSentences[trainingText];
testTextSentences = TextSentences[testText];
threadedTrainingText =Thread[trainingTextSentences -> trainingAuthors];
threadedTestText = Thread[testTextSentences -> testAuthors];
transform[d_] :=MapThread[#1 -> #2 &, {d[[1]], Table[d[[2]], Length[d[[1]]]]}];
trainingTextSmaller = Flatten[transform /@ threadedTrainingText];
testTextSmaller = Flatten[transform /@ threadedTestText];
trainingTextAssociation = trainingTextSmaller //. x : {__Rule} :> Association[x];
testTextAssociation = testTextSmaller //. x : {__Rule} :> Association[x];
unionAuthors = Union@authors;
selectAuthor[author_] := Select[trainingTextAssociation, # == author &];
selectTestAuthor[author_] := Select[testTextAssociation, # == author &];
authorsText = selectAuthor /@ unionAuthors;
authorsTestText = selectTestAuthor /@ unionAuthors;
nonNormalizedTraining = Flatten@Normal@authorsText;
nonNormalizedTest = Flatten@Normal@authorsTestText;
normalizedTrainingText = Flatten@(RandomChoice[Normal@#, 1500] & /@ authorsText);
normalizedTestText =   Flatten@(RandomChoice[Normal@#, 1500] & /@ authorsTestText);
fullTestSentences =  Select[normalizedTestText, (StringLength@First[#] =!= 0) &];
fullTrainingSentences = Select[normalizedTrainingText, (StringLength@First[#] =!= 0) &];
KeySort@Counts[StringLength /@ Keys[fullTrainingSentences]];
reducedTrainingSentences = RandomSample[fullTrainingSentences, 16];
reducedTestSentences = RandomSample[fullTestSentences, 16];
reducedTrainingArticles = RandomSample[fullTrainingArticles, 100];
reducedTestArticles = RandomSample[fullTestArticles, 100];
groupedArticles = MapAt[{#, CreateUUID[]} &, threadedTestText, {All, 2}];
groupedSentences = Flatten[transform /@ groupedArticles];
Classifiers that Process Full-Text Articles
cArticles = Classify[fullTrainingArticles]
cArticlesMeasure = ClassifierMeasurements[cArticles, fullTestArticles]
cArticlesMeasure["Accuracy"]
cArticlesMeasure["ConfusionMatrixPlot"]
Classifiers that Process Sentences - Normalized (equal lengths)
cSentences = Classify[fullTrainingSentences]
cSentencesMeasure =  ClassifierMeasurements[cSentences, fullTestSentences]
cSentencesMeasure["Accuracy"]
cSentencesMeasure["ConfusionMatrixPlot"]
###Classifiers that Process Non-Normalized Sentences
cNonNormalizedSentences = Classify[nonNormalizedTraining]
cNonNormalizedSentencesMeasure = ClassifierMeasurements[cNonNormalizedSentences, nonNormalizedTest]
cNonNormalizedSentencesMeasure["Accuracy"]
cNonNormalizedSentencesMeasure["ConfusionMatrixPlot"]
PostProcessing of Results with Stochastic Model
resultNonNormalizedSentences =  cNonNormalizedSentences[groupedSentences[[All, 1]]]
Counts[resultNonNormalizedSentences[[1 ;; 31]]]
groupsByUniqueArticleIdentifier =   groupedSentences[[All, 2]] // Dataset;
grouped = Counts[groupsByUniqueArticleIdentifier[All, 2]]
groups = Values@Normal@grouped;

helperToSelectRange[indices_, range_]:= Select[indices, #[[2]] < range&];

lookupCount[groupedSentenceTable_, nonNormalizedTestTable_, resultNonNormalizedSentencesTable_]:= Module[
    {range, numOfGroups, counts, s, start, end, groups, indices},
    (*range = Length[resultNonNormalizedSentencesTable];*)
    s = groupedSentenceTable[[All,2]]//Dataset;
    counts = Counts[s[All,2]];
    groups = Join[{1}, Values @ Normal @ counts];
    end = (FoldList[Plus, 0, groups]-1) [[3;;-1]];
    start = Join[{1}, end + 1] [[;;-2]];
    indices = Transpose[{start, end}];
    Counts /@ Table[resultNonNormalizedSentencesTable[[indices[[i,1]];;indices[[i,2]]]], {i, 1, Length @ indices}]
]

getHighestCount[assoc_]:= First @ First @ (Reverse @ SortBy[assoc, # &] /. Association -> List)
res = lookupCount[groupedSentences, nonNormalizedTest, resultNonNormalizedSentences]
compare = getHighestCount /@ res;
(r = {testAuthors, compare} // Transpose) // Dataset
check[str_]:= If[str[[1]] == str[[2]], True, False]
differentAuthors = {};
For[i = 1, i <= Length @ r, i++,
    If[ check[r[[i]]],
       Nothing,
       AppendTo[differentAuthors, r[[i]]]
    ];
]
Dataset@differentAuthors
accuracy = N[1 - (Length[differentAuthors]/Length[trainingAuthors])]
Using Feature Extraction
fe=FeatureExtraction[trainingText];
mappedTestText = fe[testText];
dr3 = DimensionReduction[mappedTestText,3,Method->"TSNE"];
dr2 = DimensionReduction[mappedTestText, 2, Method -> "TSNE"];
dr3D=dr3[mappedTestText];
dr2D = dr2[mappedTestText];
dr3Dp=Partition[dr3D,25];
dr2Dp = Partition[dr2D, 50];
Manipulate[ListPlot[plotSetClas[[n]], PlotLabel -> "Neural Network",
  PlotRange -> {{-50, 50}, {-50, 50}}, PlotTheme -> "Marketing",
  PlotStyle -> Blue], {n, 1, 25, 1}, "Author"];
plot3D=ListPointPlot3D[dr3Dp,Filling->Bottom];
plot2DFeatExtr = ListPlot[dr2Dp, PlotLabel -> "FeatureExtraction"];
plot2=ListPointPlot3D[dr3Dp[[#]],Filling->Bottom ]&/@Range[25];
Classification Using Neural Networks
featureExtractor2 =  NetModel["GloVe 100-Dimensional Word Vectors Trained on Wikipedia and Gigaword 5 Data"]
net = NetChain[<|"Feature Extractor" -> featureExtractor2,
   "LSTM1" -> LongShortTermMemoryLayer[50],
   "GRU1" -> GatedRecurrentLayer[100], "Pooling" -> PoolingLayer[100],
    "Linear" -> LinearLayer[], "SoftMax" -> SoftmaxLayer[]|>,
  "Output" -> NetDecoder[{"Class", unionAuthors}]]
trained =
 NetTrain[net, fullTrainingArticles, All,
  ValidationSet -> fullTestArticles,
  LearningRateMultipliers -> {"Feature Extractor" -> 0, _ -> 1},
  MaxTrainingRounds -> 20, TargetDevice -> "CPU"]
Training Results
trainedBest = trained;
trainedBest["TrainedNet"];
trainedBest["TrainingNet"];
trainedBest["ErrorRateEvolutionPlot"];
trainedBest["FinalRoundErrorRate"];
trainedBest["TotalTrainingTime"];
trainedBest["Properties"];
Neural Network Pruning
trainedVectorizer = NetDrop[trainedBest["TrainedNet"], -2]
trainedBest["TrainedNet"]
Using the Pruned Neural Network as a Vectorizer
features = trainedVectorizer[fullTestArticles[[All, 1]]]
Reducing the Dimension of the Resulting Vector Space
dimReduction = DimensionReduction[features, 2, Method -> "TSNE"]
drx = dimReduction[features];
plotSet = Partition[drx, 25];
plot2DNeuralNetwork =  ListPlot[plotSet, PlotLabel -> "Neural Network"];
GraphicsRow[{plot2DFeatExtr, plot2DNeuralNetwork}, Frame -> All,  ImageSize -> 800]
Data Visualization
plotx = Import[
   "/Users/jaimebuitrago/Dropbox/Jaime/Wolfram SummerSchool/plotSet.mx"];
NNMan = Manipulate[
  ListPlot[plotx[[n]], PlotLabel -> "Neural Network",
   PlotRange -> {{-50, 50}, {-50, 50}}, PlotTheme -> "Marketing",
   PlotStyle -> Red, ImageSize -> Full], {n, Range[25]}, "Author",
  ContentSize -> {600, 460}, ControlType -> Setter,
  ControllerLinking -> All]
plotSetClas =
  Import["/Users/jaimebuitrago/Dropbox/Jaime/Wolfram Summer \
School/plotSetClas.mx"];
ClasMan =
 Manipulate[
  ListPlot[plotSetClas[[n]], PlotLabel -> "FeatureExtraction",
   PlotRange -> {{-50, 50}, {-50, 50}}, PlotTheme -> "Marketing",
   PlotStyle -> Blue, ImageSize -> Full], {n, Range[25]}, "Author",
  ContentSize -> {600, 460}, ControlType -> Setter,
  ControllerLinking -> All]
TabView[{ "Classifier" -> ClasMan, "Neural Network" -> NNMan}]
ClasMan =
 Manipulate[
  ListPlot[plotSetClas[[n]], PlotLabel -> "FeatureExtraction",
   PlotRange -> {{-50, 50}, {-50, 50}}, PlotTheme -> "Marketing",
   PlotStyle -> Blue, ImageSize -> Full], {n, Range[50]}, "Author",
  ContentSize -> {600, 460}, ControlType -> PopupMenu]
TabView[{ "Classifier" -> ClasMan, "Neural Network" -> NNMan}]