Idea:
In education, it's essential to provide a visual representation of some operations. So, the primary purpose is to create a function which generates an image with the visual representation of the list commands.
Approach
The first step is to assign each element of the list with a distinct color using color association.
colorAssociation = <|1->Red,2->Blue,3->Green,4-> Yellow,5->Purple,6-> Pink,7-> Orange,8 -> RGBColor[0.9,0.5,0.1],9-> RGBColor[0.23,0.95,0.8], 10-> Brown|>;
listNew =Table[Style[list[[i]],FontColor->colorAssociation[i]],{i,Length[list]}];
After that, by using the Rasterize function I convert input and output into an image.
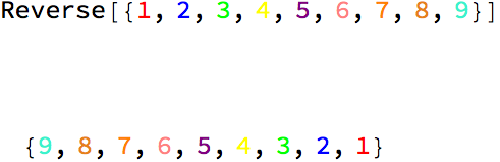
img1 = Rasterize[Column[{StringJoin[{"Reverse[",ToString[listNew,StandardForm],"]"}]," "," "," ",Row[{" "ToString[Reverse[listNew],StandardForm]}]}],ImageSize->500]
Then, using the ImageValuePosition function, I made a list which contains lists of the positions the given color.
inputColorlist = InputForm[listNew]
imglist = Table[ImageValuePositions[img1,inputColorlist[[1,k,2,2]],0.05],{k,Length[list]}];
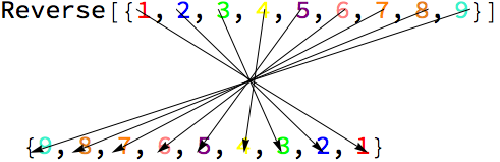
So, for the particular color position list, the half coordinates are of input elements, and other half coordinates are of the output element. So, if we consider the list of 'n' no of coordinates, then the coordinates up to $\frac{n}{2}$ are of the input element, and the coordinates from $\frac{n}{2}+1$ to $n$ are of the output element. So with this logic, I draw arrows from $(\frac{n}{2})^{th}$ coordinate to $(\frac{n}{2}+1)^{th}$ coordinate with Graphic function and put the arrows on the Rasterized image using the ImageCompose function
RevImage = ImageCompose[img1,Show[Table[Graphics[{Arrowheads[0.03],Arrow[{imglist[[i,1]],imglist[[i,Ceiling[Length[imglist[[i]]]/2 + 1]]]}]}],{i,Length[list]}]]]
VisualizeReverse[{1,2,3,4,5,6,7,8,9}]
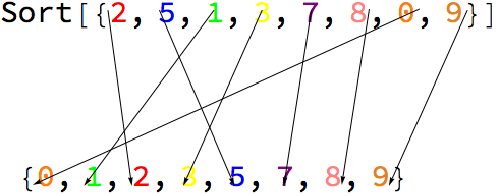
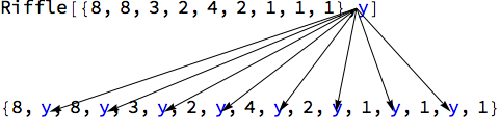
So, like a similar approach, I did it for Sort, Riffle and Transpose function.
VisualizeSort[{2,5,1,3,7,8,0,9}]
VisualizeRiffle[{8,8,3,2,4,2,1,1,1},y]
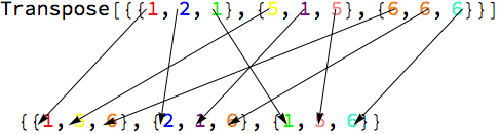
VisualizeTranspose[{{1,2,1},{5,1,5},{6,6,6}}]
Conclusion:
So, there is only one problem with this. It only works for the total of 10 elements, because of assigning color up to 10 elements. If I assign elements with random color then sometimes it creates the same color, and sometimes the input form is not recognizing the color up to an absolute number precision in RGB color.
Future Work:
Make it more general. So, It can work up to any number of elements. Animated images will be another good visualization option.
Github link:
https://github.com/dthanawa/Summer2018Starter/blob/master/StudentDeliverables/WSS_PROJ.nb


