Benford's Law is the claim that, in any naturally produced set of numbers, the number one will appear the most frequently as the first digit, with each subsequent digit after one appearing with smaller and smaller probability. In general, one appears about 30% of the time, two appears around 18% of the time, and nine appears less than 5% of the time
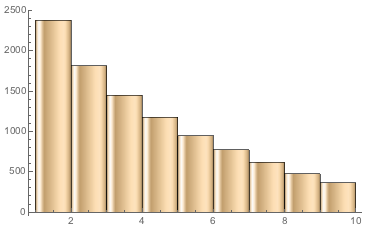
Cryptocurrency transactions consist of many attributes, such as the block, where the information was stored, and hash number, as well as the exact time that the blocks were mined. These attributes and data are stored in ledgers called blockchains. Wolfram provides an easy way of accessing blockchains, as seen below:
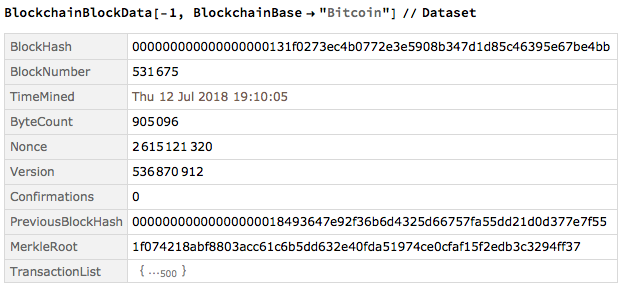
In this project, I chose to analyze the nonces and the size of each block. Nonces are random numbers that are unique to each transaction made, and they often include a timestamp in order to measure the exact time of the transaction.
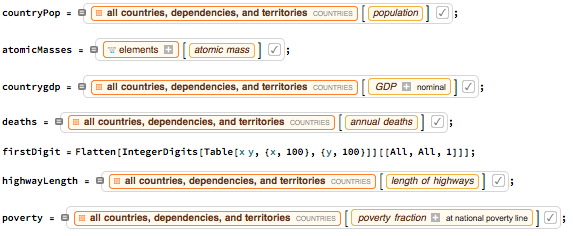
In order to see if Benford's Law applies in cryptocurrency blocks like it does in real life, histograms consisting of the frequency of digits were plotted and compared. The real life data was obtained through Wolfram, and included datasets about the population in different countries, GDP of countries, the first digit of the product of two numbers, annual number of deaths in each country, total length of the highways in different countries, and the atomic masses of the elements. The cryptocurrency datasets comprised of the nonce numbers and size of the blocks.
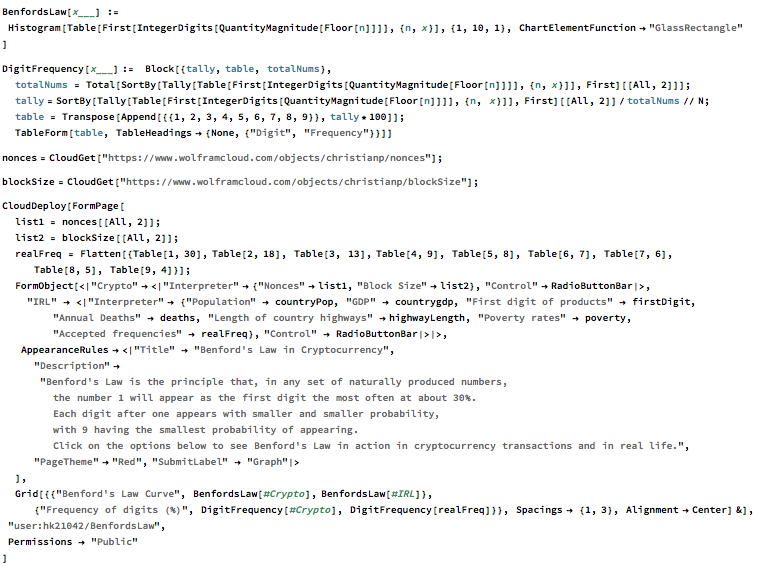
This project created a function in order to graph different data sets of numbers as a histogram.
BenfordsLaw[x___] := Histogram[Table[First[IntegerDigits[QuantityMagnitude[Floor[n]]]], {n,
    x}], {1, 10, 1}, ChartElementFunction -> "GlassRectangle"]
The function takes in a list of numbers. In the case of sets taken from real life data, the list often consists of decimal numbers with units. In order to accommodate this, the list is simplified by flooring each element (Floor), removing any attached units (QuantityMagnitude), converting each element into the list of its digits (IntegerDigits), and taking only the first digit from each element (First). The resulting list is plotted as a histogram.
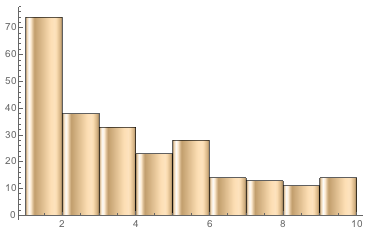
In my microsite (here), the user can chose two graphs, one from Bitcoin blocks and one representing a natural set of numbers, and view them side by side. In addition, the exact frequency of each digit in the transactions are measured using another function, DigitFrequencies:
DigitFrequency[x___] :=   Block[{tally, table, totalNums},
  totalNums = Total[SortBy[Tally[Table[First[IntegerDigits[QuantityMagnitude[Floor[n]]]], {n, x}]], First][[All, 2]]];
  tally = SortBy[Tally[Table[First[IntegerDigits[QuantityMagnitude[Floor[n]]]], {n, x}]], First][[All, 2]]/totalNums // N;
  table = Transpose[Append[{{1, 2, 3, 4, 5, 6, 7, 8, 9}}, tally*100]];
  TableForm[table, TableHeadings -> {None, {"Digit", "Frequency"}}]]
This function calculates the total number of elements in the list (totalNums) and creates a sorted list of the frequency of each digit using Tally[] (tally). Each digit from 1-9 is then appended to their respected frequency and transposed into the variable table. The function then outputs the table, consisting of all digits and their frequency as a percentage.
The frequencies of all the digits are then compared to the frequencies accepted in real life, printed out next to it for side by side comparison.
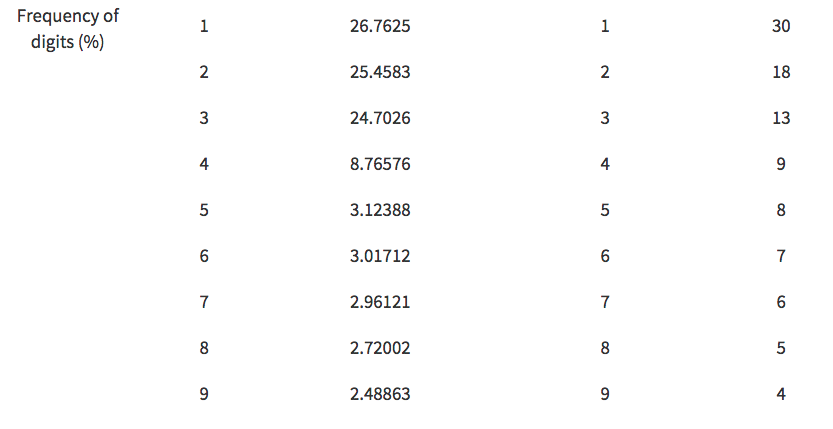
In analyzing the frequencies of digits in the nonces, one can see that the percentages of each digit were most often off by about five percent and did not follow the same smooth curve as in Benford's Law. However, the frequency of ones was still the highest, and each subsequent digit appeared with less and less probability.
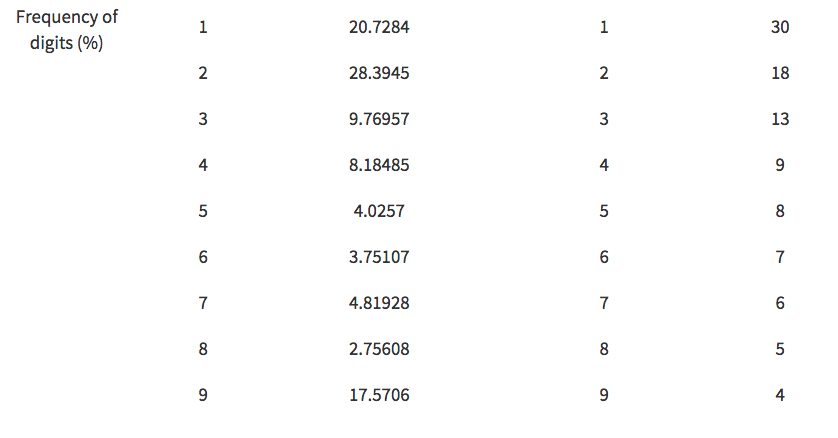
Similar to above, the frequencies of digits in the block sizes differed from the law by a few percent. However, as can be seen, the data did not follow Benford's Law as well as the nonces did, as two appeared in a higher percentage than the ones. From there, each subsequent probability followed a smooth curve, except for the digit 9, which showed an usually high probability of appearing.
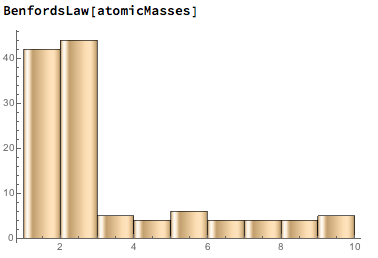
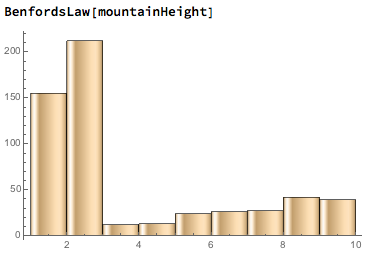
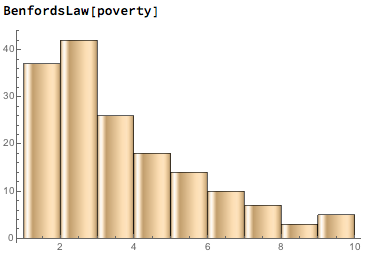
The conclusion that cryptocurrency attribute numbers don't always follow Benford's Law can then be made. In addition, one could claim that when one does not appear the most frequently in a set of numbers, the digit two will. In each of the following plots (the atomic masses of the elements, heights of mountains, and poverty rates in countries), two appears the most often, with one appearing the second most frequently:
tl;dr
The function for Benford's Law ended up showing the correct curve for many real life data sets, such as country population, the GDP of different countries, and the first digit of the product of numbers less than 100. However, the same pattern didn't always apply to all naturally produced data sets. For example, the atomic masses of the elements and the heights of the mountains in the world did not follow Benford's Law exactly. The Benford's Law function was then applied to the nonce numbers, a random number that is unique to its transaction, and block sizes of about 500,000 Bitcoin blocks. The nonces ended up following Benford's Law, albeit very roughly, but the sizes of the blocks did not. As shown by the comparison between the frequencies of digits in transactions and in natural data, the percentages of digits in nonces did decrease between digits 1 and 9, but the exact percentages were often often off by about five percent. The dataset representing the block sizes were also off from the natural average by several percent, but deviated even further from Benford's Law because the frequency of 2's were even higher than 1's, and the number of 9's appeared an unnaturally large amount of times. It was found that when Benford's Law ratios didn't apply, the number of 2's appeared more often than 1's.
The Code:
Special thanks...
... to Christian Pasquel, my mentor, for getting all my data, consisting of 531,000 nonce numbers and block sizes, and to Andrea for helping me get my microsite together.