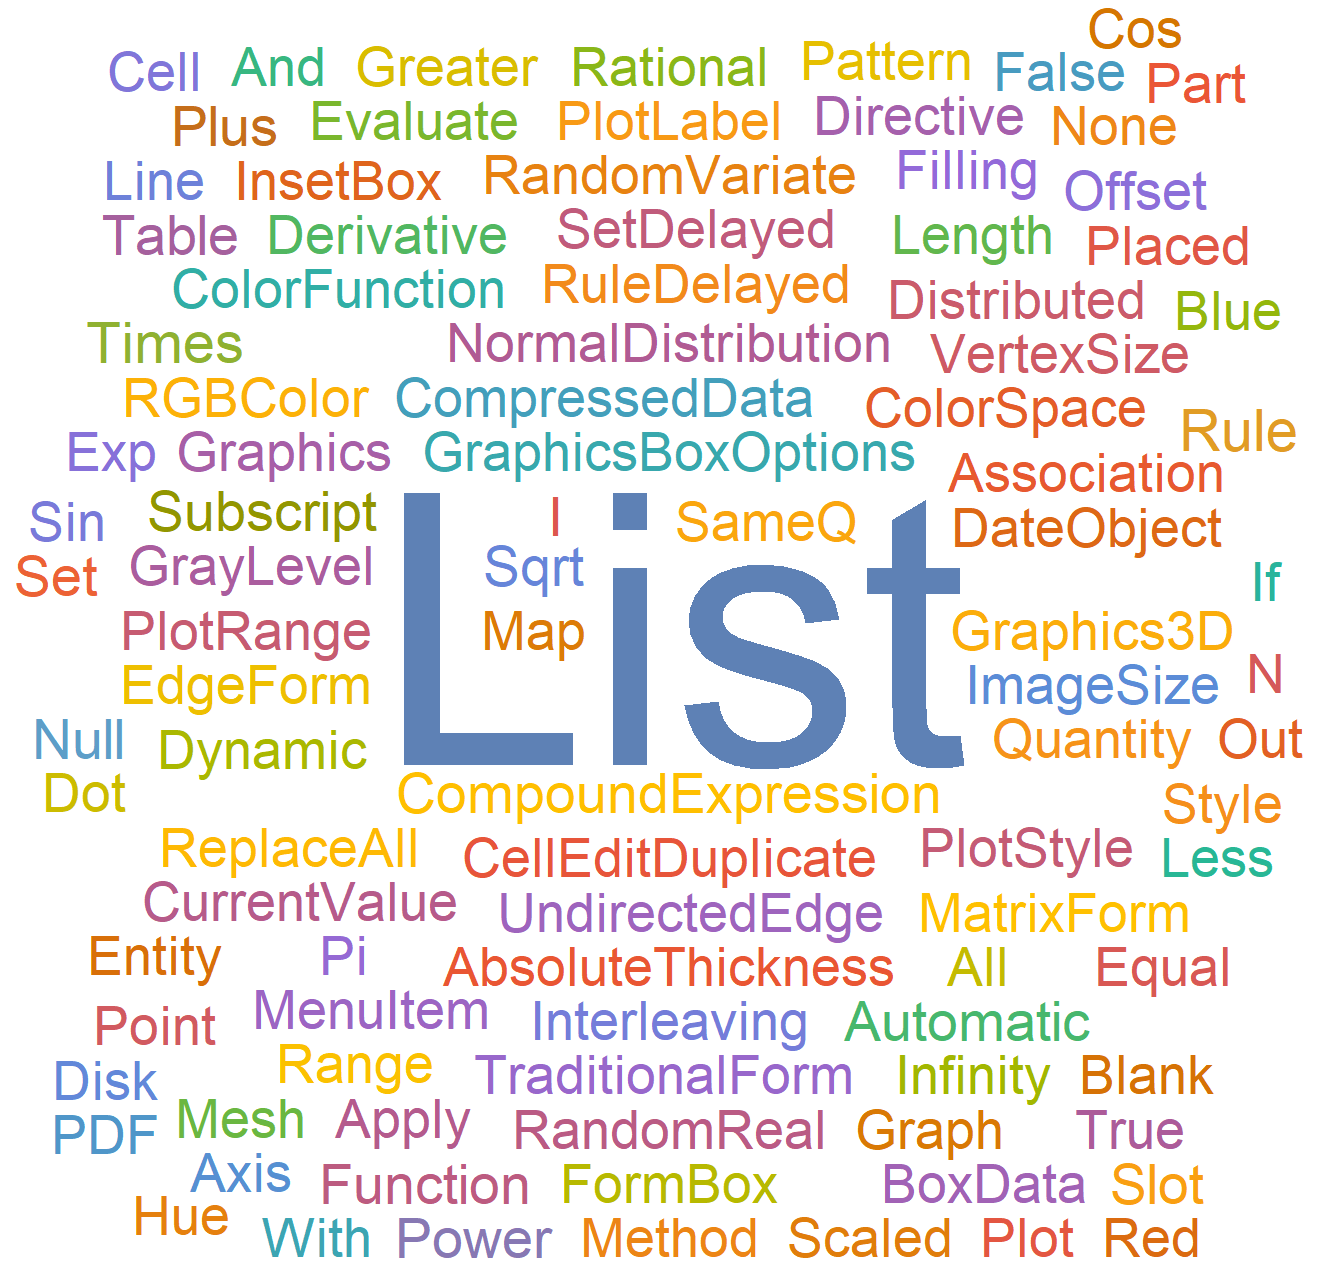
This is a word cloud of the frequencies of the most common mathematica functions.
Introduction
The purpose of this project was to scrape the example data from the Wolfram Language Documentation Center and to retrieve function names from the cells, for analysis. This included looking at functions that were commonly used together, factoring a weighting system similar to TF IDF where the more a term appears overall, it has less value, and as a result, function use is balanced out accordingly. Also, a community graph plot was made, visualising connection across various functions, and attempts to group functions that have similar links, with some exciting results.
Retrieving the Data
Since the documentation lies within the file explorer, they can be found and imported with the following code:
files = FileNames["*",
  FileNameJoin@{$InstallationDirectory, "Documentation", "English",
    "System", "ReferencePages", "Symbols"}];
The data must then be refined and processed with a function that imports the cells, deletes image cases (this is because they tamper with the list value) and hold the function to ensure it does not evaluation like so:
getSymbolData[notebook_] :=
 Module[{expressions,
   noImages},(*Defines expressions and noImages locally*)
  expressions =
   NotebookImport[notebook,
    "Input" ->
     "HeldExpression"]; (*Imports one given notebook by it's \
directory*)
  noImages =
   DeleteCases[expressions, HoldPattern[Image[_RawArray, ___]],
    Infinity];(*Remove images so they don't clutter the list data*)

  (*Counts up functions used inside other functions e.g Plot[Sin]*)
  Counts@Flatten@Cases[
     noImages,
     (f_Symbol)[args : (_Symbol[___]) ..] :>
      Cases[
       HoldComplete[args], (g_Symbol)[___] :> HoldComplete[f, g]],
     {2, Infinity}]]
With this, we can introduce functions that seek lists in the form {symbol1,symbol2) and scan across every function to create a graph of relations.
MutualFunctionUse[sym1_, sym2_, functset_] :=
 Cases[functset, {{sym1, If[sym2 == "", _String, sym2]}, _Integer}]
And further shorten the data by selecting the functions that appear the most with the specified function. 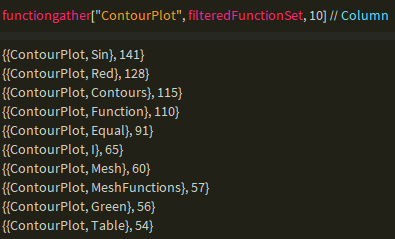
Visualization
The data above can be easily manipulated into a graph with the edge weighting being the second item in the main list and the edge connection being the first connection.
functionGraph[x_, n_, functset_] :=
 Module[{edges, edgelabels, sizes, mutualfunctions, graph, finished},
  mutualfunctions = functiongather[x, functset, n];
  edges =
   Thread[mutualfunctions[[1 ;;, 1, 1]] \[UndirectedEdge]
     mutualfunctions[[1 ;;, 1, 2]]];
  edgelabels =
   Thread[Thread[
      mutualfunctions[[1 ;;, 1, 1]] \[UndirectedEdge]
       mutualfunctions[[1 ;;, 1, 2]]] -> mutualfunctions[[1 ;;, 2]]];
  finished =
   Thread[Part[edgelabels, All, 1] ->
     Evaluate@(Placed[#, Tooltip] & /@ (Part[edgelabels, All, 2]))];
  sizes =
   Append[Thread[
     Evaluate@mutualfunctions[[1 ;;, 1, 2]] -> (#*0.1 &) /@
       Floor /@
        Log /@ Evaluate@(SymbolFreq[#] & /@
            mutualfunctions[[1 ;;, 1, 2]])],
    x -> 0.1*Floor@Log@SymbolFreq[x]];

  graph =
   Graph[edges, VertexLabels -> Placed["Name", Center],
    VertexSize -> sizes, EdgeLabels -> finished, Background -> White,
    ImageSize -> Full,
    EdgeWeight -> Flatten@mutualfunctions[[All, 2]]];
  {CommunityGraphPlot[graph],
   MatrixPlot[WeightedAdjacencyMatrix[graph]]}

   ]
Most of the code above is for visual effects, such as a tooltip that appears when hovering over the graph. Most of the threading is done to describe the process before, just to connect it in the form symbol1 - symbol2 -> edgeWeight and the sizes were all processed through the logarithm function followed by a multiplication of 0.1 to scale nodes to size. The parameters functset is used for convenience, for example, if the user inputted a filtered version without incredibly common functions such as List to pollute the pool, it would return a different graph, and the n selects the top n used functions. The function also returns a weighted matrix plot of the graph, like a heat map which is hidden as the graph takes up the full window. Here is an example of function graph: 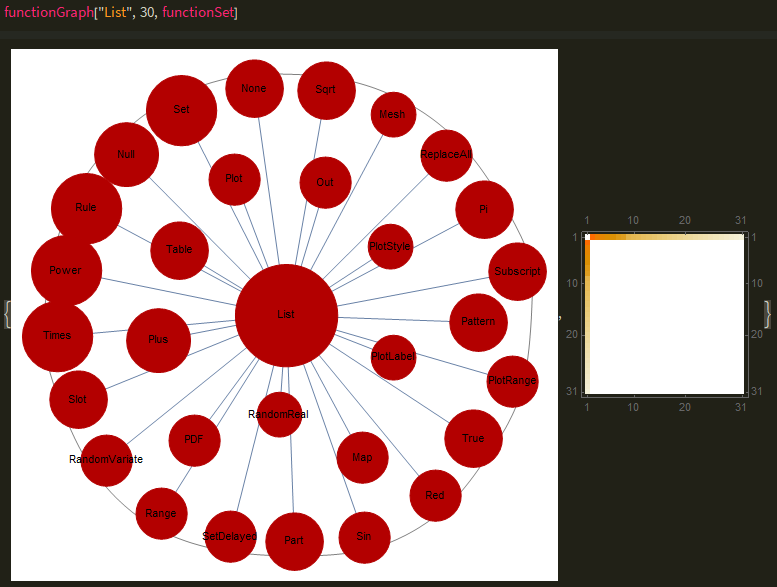
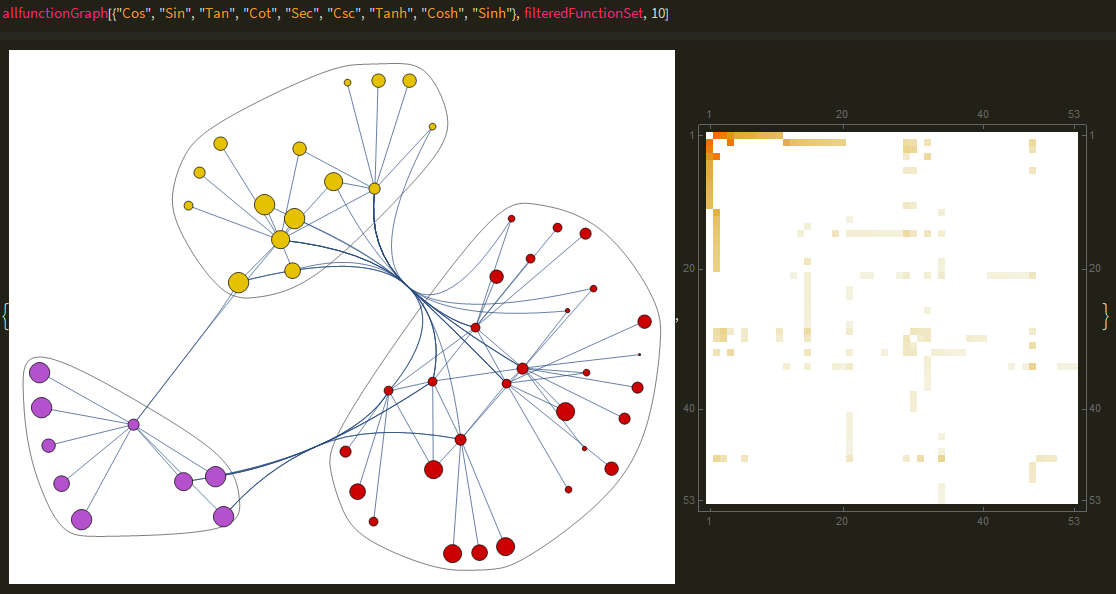
The code can be further extended to process across several functions, joining to make a bigger community graph, revealing more relationships and communities like so:
allfunctionGraph[x_, functset_, n_] :=
 Module[{edges, edgelabels, sizes, mutualfunctions, graph, finished},
  mutualfunctions = functiongather[#, functset, n] & /@ x;
  edges =
   Thread[Flatten@mutualfunctions[[All, All, 1, 1]] \[UndirectedEdge]
     Flatten@mutualfunctions[[All, All, 1, 2]]];
  edgelabels =
   Thread[Thread[(Flatten@
         mutualfunctions[[All, All, 1, 1]] \[UndirectedEdge]
        Flatten@mutualfunctions[[All, All, 1, 2]])] ->
     Flatten@mutualfunctions[[All, All, 2]]];
  finished =
   Thread[Part[edgelabels, All, 1] ->
     Evaluate@(Placed[#, Tooltip] & /@ (Part[edgelabels, All, 2]))];
  sizes =
   Append[Thread[
     Evaluate@Flatten@mutualfunctions[[All, All, 1, 2]] -> (#*0.1 &) /@
        Floor /@
        Log /@ Evaluate@(SymbolFreq[#] & /@
            Flatten@mutualfunctions[[All, All, 1, 2]])],
    Thread[x -> 0.1*Floor /@ (Log /@ (SymbolFreq /@ x))]];
  graph =
   Graph[edges, VertexLabels -> Placed["Name", Tooltip],
    VertexSize -> sizes, EdgeLabels -> finished, Background -> White,
    ImageSize -> Full,
    EdgeWeight -> Flatten@mutualfunctions[[All, All, 2]]];
  {CommunityGraphPlot[graph],
   MatrixPlot[WeightedAdjacencyMatrix[graph], ImageSize -> Full]}
   ]
The above code is just a generalization of the first function, with list processing being added to accommodate for the list of inputs. While there are no labels, function names and connections appear as one hovers over an edge/node.
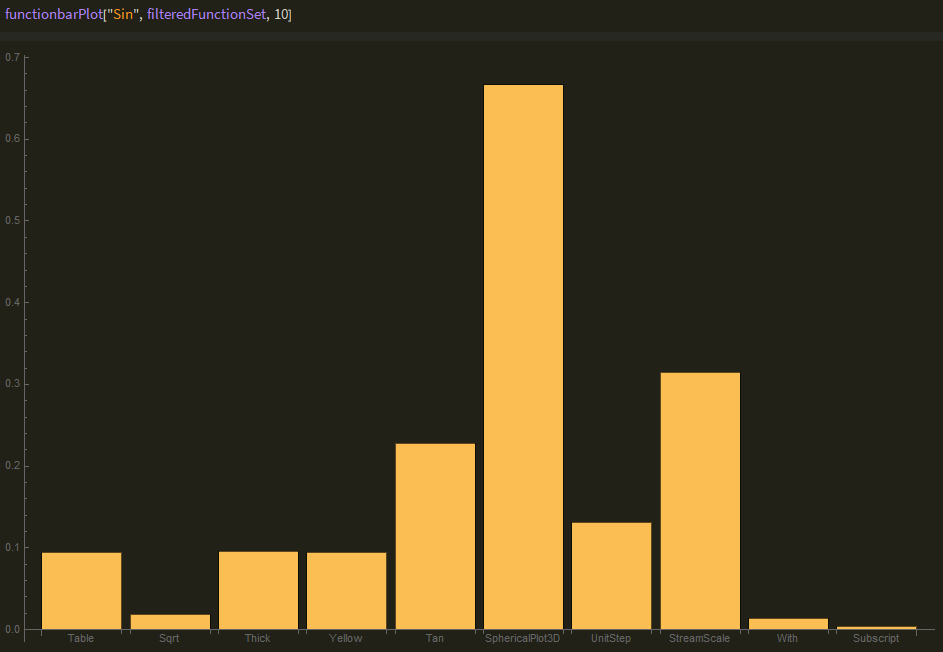
The final visualization is a weighted bar chart that takes in a function and returns a bar chart with weighted values, which is the quotient of the function's frequency with the specified functions and the functions general frequency across all cells. The weighting system is simple at this stage but can be improved to further avoid symbols such as List or Power polluting the sample space.
Errors and alternative pathways
Many of the issues faced were time complexity related, with inappropriate sorting algorithms being utilized which unintentionally increased the runtime far more than should be expected, for example the initial algorithm would run in a time approximately cubed to the input but could be easily optimized to run in quadratic time, which could have the potential to reduce the run time from 50 minutes to less than a minute. The unoptimized algorithm was the primary bottleneck, as importing over 5146 files with an optimized algorithm would be inefficient and would become useless if the model were to take in a larger data set from other websites or files.
Conclusion & Future Work
The data-set used was small, and intentionally designed as examples, which led to much more to be desired. Other sources of function usage such as the Mathematica StackExchange or wolfram alpha would greatly expand the database and also allow for more detail graphs. This is a small stepping stone to a bigger project which entails using machine learning to register user input to understand what function they want to use, and the graph provided has insight into navigating through keywords and the desired function. Credit to Richard Hennigan for providing the scraped data and assisting me with the project.
Github link to the notebook: https://github.com/Theorvolt/CommonlyPairedWolframFunctions


