Message Boards Message Boards

7
|
69927 Views
|
6 Replies
|
18 Total Likes
View groups...
Share
Share this post:

Creating a 3D mesh plot and exporting it to an STL file for 3D printing

Posted 11 years ago
Hello all,

I've been trying to create a 3 D plot from my data. I have my X,Y, Z matrices, where Z = f(X,Y). I have my matrices in excel, which I've imported to Mathematica.
A little bit of background here - I've not used Mathematica before. But fairly comfortable with Matlab. I'm trying to use Mathematica because it lets me create plots where I can create 3D models with tubes as opposed to surfaces on Matlab.
My final goal is to create a 3D surface and export it as an STL file so that it can be printed using a 3D printer.

Here's an image of what I'm trying to make:


I'd appreciate it if someone can help me with this.
Thanks.
POSTED BY: Phalgun Lolur
6 Replies
Posted 10 years ago

I just tapped on the 3D plot and saved as STL file to print on 3d. Nice result of dodecahedron.

POSTED BY: kulbirdi
Let's make up some data points in simple matrix form and plot them with ListPlot3D in such a way that only mesh is visible.
data = Table[i Sin[j^2 + i], {i, 0, Pi, .3}, {j, 0, Pi, .3}];
p = ListPlot3D[data, Mesh -> 7, PlotStyle -> None, InterpolationOrder -> 2]


The code below will extract info about mesh and replace it with printable 3D objects - spheres and cylinders.
 pts = p[[1, 1]]; (* gets all points of interpolation *)
 
 rad = .1; (* radius of tubes and spheres *)
 fre = 5; (* sampling rate of interpolated points *)
 obj =
  Graphics3D[
   {
    (* tube will make cylinders in STL file *)
    p[[1]] /. Line[l_] :> {White, Tube[l[[1 ;; -1 ;; fre]], rad]},
   
   (* sphere to close the breaks between the cylinders *)
   GraphicsComplex[pts, Sphere[Flatten[Cases[p, Line[l_] :> l[[1 ;; -1 ;; fre]], Infinity]] // Union, rad]]
   },
  BoxRatios -> Automatic];

Export["test.stl", obj]

POSTED BY: Vitaliy Kaurov
So the plot you provided is not built from your data? Also what kind of data you have? Did you try to visualize them in Mathematica? - we have a lot of functions for that - ListPlot3D and similar. Without more infirmation it is very hard to move ahead. 
POSTED BY: Vitaliy Kaurov
Posted 11 years ago
That's correct. The plot I provided was in fact based of Segermen's code. I just used it as an example to show what I want to do with my data. I'm sorry about the confusion. I should have been more clear earlier.

I have matrices of X,Y and Z where Z=f(X,Y). I tried visualizing it in Mathematica. But I'm only able to do it as a solid surface. Not as a mesh plot.

So, what I'm trying to do is import my data into Mathematica and create a mesh plot of it and if possible create tubes around the each line so that it can be exported as an STL file and printed with a 3D printer.
POSTED BY: Phalgun Lolur
Posted 11 years ago
Dear Vitaliy,

I have already looked into the paper by Segermen, actually. He uses a parametric funtion to get his mesh. 

What I'm trying to do is generate a mesh plot from my data. I don't have a functional form to it. That is something I'm unable to do, which is also why I couldn't supply any code to this query. 

I would appreciate it if you can help me in this direction.

Thanks.
POSTED BY: Phalgun Lolur
Generally it is always a good idea to provide working code so that others have a starting point.

All this is very easy to do in Mathematica. No need to use Excel either, because I see that you build analytic surfaces that can be sampled in Mathematica too.


First I recommend reading Notes on 3D printing by Henry Segerman who did a lot of work on the subject and published a paper.

A rather quick summary for you about specifically your problem. Here is the code:
 f[u_, v_] := {u, v, u^2 - v^2};
 scale = 40;
 radius = 0.75;
 gridSteps = 10;
 curvesU = Table[scale*f[u, i], {i, -1, 1, 2/gridSteps}];
 curvesV = Table[scale*f[j, v], {j, -1, 1, 2/gridSteps}];
 tubesU = ParametricPlot3D[curvesU, {u, -1, 1},
    PlotStyle -> Tube[radius], PlotRange -> All];
 tubesV = ParametricPlot3D[curvesV, {v, -1, 1},
   PlotStyle -> Tube[radius], PlotRange -> All];
corners =
  Graphics3D[
   Table[Sphere[scale f[i, j], radius], {i, -1, 1, 2}, {j, -1, 1, 2}]];
output = Show[tubesU, tubesV, corners]

Export["MathematicaParametricSurface.stl", output]

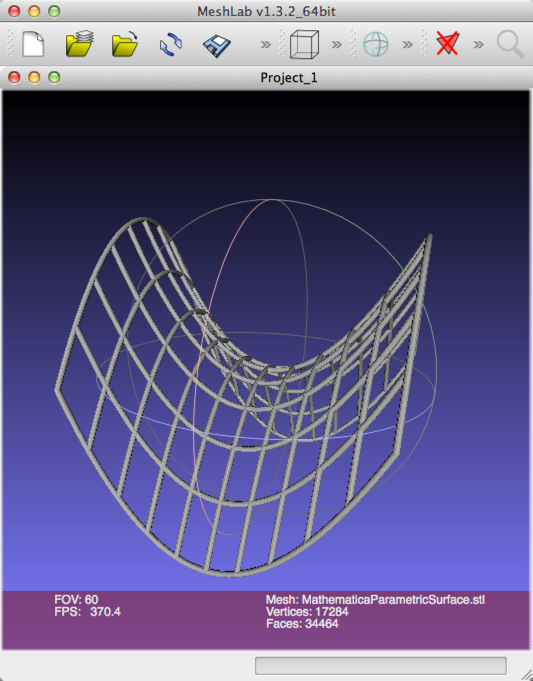
Here is how the resulting STL file is viewed in an independent STL viewing program - for example MeshLab which is free:


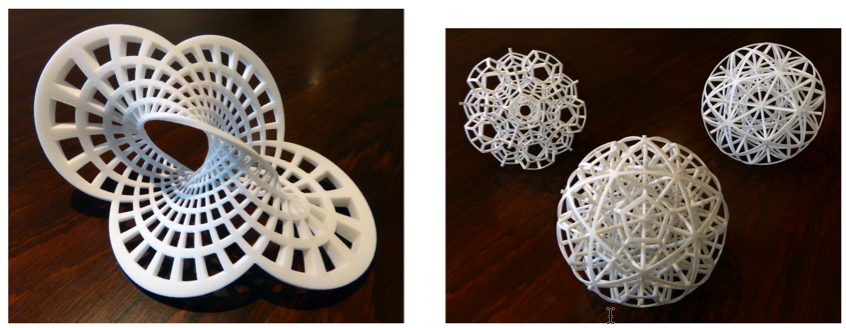
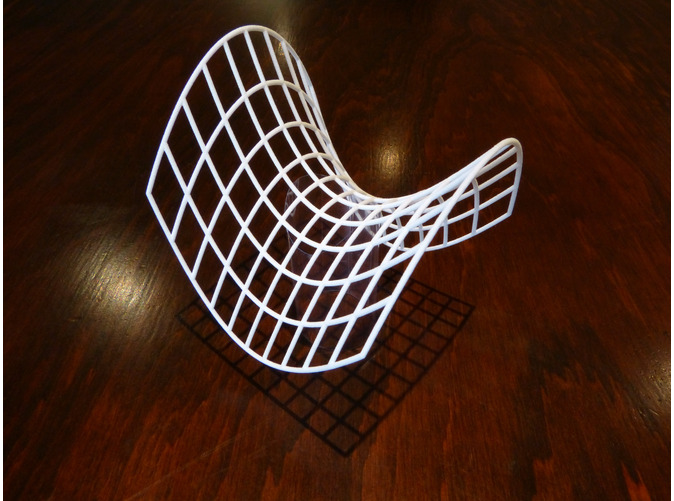
And here is final 3D printed result you can find in Shapeways store:


Now sometimes you will wish to plot surfaces as they are, not as meshes. Here is a simple example.
model = RevolutionPlot3D[{Sin[t] + Sin[5 t]/10,
   Cos[t] + Cos[5 t]/10}, {t, 0, Pi},
  RegionFunction -> (Sin[5 (#4 + #5)] > 0 &), Mesh -> None,
  BoundaryStyle -> Black, PlotStyle -> Thickness[.1]]

Export["model.stl", model];
Import[%]


Now further very useful links:
POSTED BY: Vitaliy Kaurov
Reply to this discussion
Community posts can be styled and formatted using the Markdown syntax.
Reply Preview
Attachments
Remove
or Discard

Group Abstract Group Abstract