The sensitivity lines(NicholsGridLines) in NicholsPlot in Mathematica drawn differently from what is drawn in Matlab and what I learned in lectures in control systems.
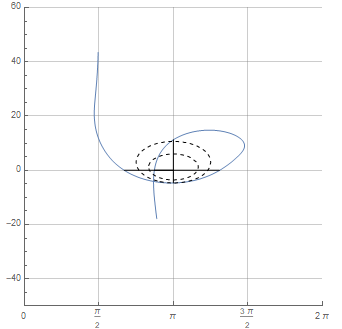
Here we can see the function P[s]=-15 (1+0.2 s/3+(s/3)^2)/(s(1+s/2)(1-1.6 s/5+(s/5)^2)(1+0.2 s/7+(s/7)^2)) which by wolfram is not Entering the 3dB sensitivity loop (just below (Pi,0)) and by Matlab it does. Wolfram Mathematica are drawing the Nichols Grid Lines as a reflection with respect to the x axis compared to what i learned at control system and Matlab for some reason. in addition, Mathematica draws the plot around the phase pi and Matlab around -Pi, why these differences?
Is there a option for flipping these grid-lines somehow? Or can someone explain why it is drawn as shown?
The code I used to draw the plot:
NicholsPlot[P[s],
 GridLines -> {Range[-2 \[Pi], 2 \[Pi], 0.5 \[Pi]], Automatic},
 StabilityMargins -> True, PlotRange -> {{0, 2 \[Pi]}, {-50, 60}},
 NicholsGridLines -> {{ -10^((3/20)), -10^((6/20))} ,},
 ScalingFunctions -> {"Radian", Automatic},
 Ticks -> {Range[-2 \[Pi], 2 \[Pi], \[Pi]/2], Automatic}]
Dynamic[MousePosition["Graphics"]]


