Message Boards Message Boards

0
|
4464 Views
|
2 Replies
|
2 Total Likes
View groups...
Share
Share this post:

Plot a differential equation of two dependent variables?

Posted 6 years ago

I would like to know how to plot $$\frac{x(t)-X(t)}{y(t)-Y(t)} = \frac{y'(t)}{x'(t)}$$ X(t) and Y(t) are defined, such as e^t, Sin(t), etc., but I don't know how to get Mathematica to plot this. I've given it proper initial conditions that anyone could start the DE by hand and draw out the answer, but don't know how to do it for Mathematica.

POSTED BY: Joshua Champion
2 Replies

had to add an extra condition to get as many equations as variables

In[13]:= sln = 
 NDSolveValue[{(x[t] - Sin[t])/(y[t] - Exp[t]) == y'[t]/x'[t], 
   x'[t]^2 + y'[t]^2 == 1, x[0] == 1, y[0] == 2}, {x[t], y[t]}, {t, 0,
    2}]

During evaluation of In[13]:= NDSolveValue::ndsvb: There are multiple solution branches for the equations, but NDSolveValue will return only one. Use NDSolve to get all of the solution branches.

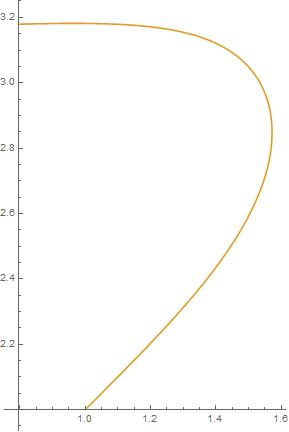
ParametricPlot[sln, {t, 0, 2}]

enter image description here

POSTED BY: Frank Kampas

Thank you!! I couldn't seem to figure out how to write it properly!

POSTED BY: Joshua Champion
Reply to this discussion
Community posts can be styled and formatted using the Markdown syntax.
Reply Preview
Attachments
Remove
or Discard

Group Abstract Group Abstract