I would be curious to know what type of general problem you are trying to solve. Now to it per se.
If you just search for "scatter plot" in docs you get ListPlot with numerous examples. The 4th example shows how to label points. You should always check docs first - they are wonderfully informative. So perhaps you mean something like this:
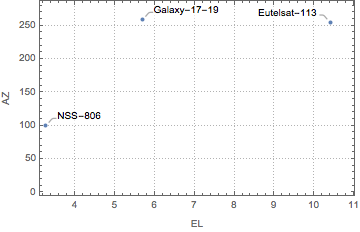
ListPlot[Callout[{#2,#3},#1]&@@@dataSatTable,PlotTheme->"Detailed",FrameLabel->{"EL","AZ"}]