Message Boards Message Boards

Import and plot data from a file with ".dat" format?

Posted 5 years ago

I need to import and data from a .dat file formatted as such:enter image description here

where the first column is the x coordinate and the second and third columns are y-coordinates for two different lines. How can I import the data and format it in a way that it's easily graphable? There is too much data to input by hand. Thank you!

POSTED BY: Aaron Fultineer
2 Replies

One way to achieve what you want would be as follows.

  1. Assuming the data has already been imported in to the notebook as per...

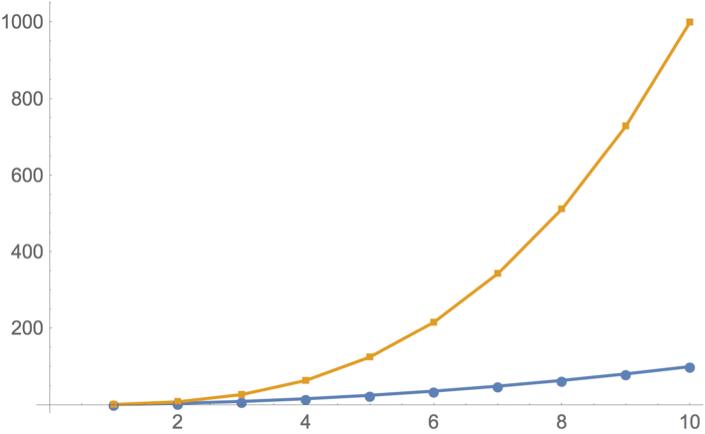
    data = {{1, 1, 1}, {2, 4, 8}, {3, 9, 27}, {4, 16, 64}, {5, 25, 
    125}, {6, 36, 216}, {7, 49, 343}, {8, 64, 512}, {9, 81, 729}, {10,
    100, 1000}};
    
  2. Use the ListPlot function as shown below...

    ListPlot[
     data[[All, {1, #}]] & /@ {2, 3}
     , Joined -> True
     , PlotMarkers -> Automatic
     ]
    
  3. This generates the 2D x-y graph... enter image description here

A notebook implementation is attached together with the example data file (CSV format).

Hope this helps,

Ian

Attachments:
POSTED BY: Ian Williams

Thank you! This is perfect.

POSTED BY: Aaron Fultineer
Reply to this discussion
Community posts can be styled and formatted using the Markdown syntax.
Reply Preview
Attachments
Remove
or Discard

Group Abstract Group Abstract