Message Boards Message Boards

0
|
5735 Views
|
10 Replies
|
12 Total Likes
View groups...
Share
Share this post:

Estimate/predict a discrete value in a dependent variables list?

Dear all,

I have three sets of discrete data as following:

Dependent Variables: Y={30,42,53, ? }

Independent Variables : X={12,14,19,22},
Z={15,18,27,33}

How can I estimate/predict ? value in dependent variables list?

Thanks for your help.

POSTED BY: M.A. Ghorbani
10 Replies

This is an interesting discussion! (In the following I am using the data from the OP posted notebook.) If one uses the full data as training-set, then the result should be better. Using then the same full data as test-set should lead to a still more improved result. I guess relevant are the relative differences:

trainingsset = Thread[Rule[Transpose@{X1, X2, X3, X4}, Y]];
cfunc = Predict[trainingsset, PerformanceGoal -> "Quality"];
relDiffData = Abs[cfunc[#1] - #2]/#2 & @@@ trainingsset;

ListLinePlot[relDiffData, PlotRange -> All, ImageSize -> Large, 
 GridLines -> Automatic, 
 Epilog -> {Red, Dashed, With[{m = Mean[relDiffData]}, Line[{{1, m}, {Length[relDiffData], m}}]]}]

which gives:

enter image description here

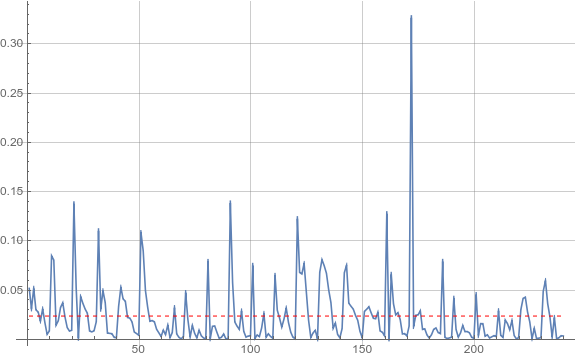
We find a mean relative difference of about 2.3%, but the discrepancies can be considerably larger. (I had expected a somewhat better agreement.) In addition I find this interesting:

Correlation[relDiffData, #] & /@ {X1, X2, X3, X4}
(* Out:   {-0.464144, 0.23598, -0.130216, 0.640481}   *)

The prediction seems to have the most problems with data set X4.

POSTED BY: Henrik Schachner

Using the notebook values, one can get Predict to give fairly good results on the even input-output pairings after training on the odd ones. Code is shown below.

In[19]:= tuples = Thread[Transpose[{X1, X2, X3, X4}] -> Y];
train = tuples[[1 ;; -1 ;; 2]];
test = tuples[[2 ;; -1 ;; 2]];

In[35]:= cfunc = 
  Predict[train, Method -> "NeuralNetwork", 
   PerformanceGoal -> "Quality"];

In[37]:= diffs = Abs[Map[cfunc, test[[All, 1]]] - test[[All, 2]]];
{MinMax[diffs], Mean[diffs], Median[diffs]}

Out[38]= {{0.00580010854625, 
  0.563060592246}, 0.17004384106, 0.115062287882}

In[39]:= cfuncDefault = Predict[train];
diffs = Abs[Map[cfuncDefault, test[[All, 1]]] - test[[All, 2]]];
{MinMax[diffs], Mean[diffs], Median[diffs]}

Out[41]= {{0.0000144387526495, 
  0.177703464205}, 0.00899411416113, 0.00674310124209}
POSTED BY: Daniel Lichtblau

Dear Mariusz and Henrik

It is a good job and fantastic!

Many thanks!

POSTED BY: M.A. Ghorbani
tuples = Thread[Transpose[{X1, X2, X3, X4}] -> Y];
train = tuples[[1 ;; -1 ;; 2]];
cfunc = Predict[train];
YPrediction = Map[cfunc, tuples[[1 ;; -1 ;; 1]][[All, 1]]];
ListLinePlot[{Y, YPrediction}]

enter image description here

By default prediction it' not so bad:

 ListLinePlot[{Abs[Y - YPrediction]}]

enter image description here

and errors.

POSTED BY: Mariusz Iwaniuk

Dear Mariusz,

According to Daniel's code for considering test data set, I think it is better we evaluate the prediction method for about 30% of all data as testing set. Is it possible to calculate the correlation coefficient between predicted and main data for testing data set?

POSTED BY: M.A. Ghorbani
Correlation[Y, YPrediction]

(* 0.996473 *)
POSTED BY: Mariusz Iwaniuk

Another unscientific approach(and the answer seems to be 63):

Y = {30, 42, 53}; SOL = InterpolatingPolynomial[Y, x]; SOL /. x -> {1, 2, 3, 4}

(* {30, 42, 53, 63} *)

Using Predict command:

trainingset = {{12, 15} -> 30, {14, 18} -> 42, {19, 27} -> 53};
p = Predict[trainingset, Method -> "NeuralNetwork", TimeGoal -> Quantity[10, "Seconds"]]
p[{22, 33}]

(*  62.7155 *)

dist = p[{22, 33}, "Distribution"]
Plot[PDF[dist, x], {x, 62, 63.5}, PlotRange -> All]

enter image description here

POSTED BY: Mariusz Iwaniuk

Hi Mariusz, I definitely prefer your approaches - nice! Regards -- Henrik

POSTED BY: Henrik Schachner

Dear Mariusz,

The enclosed file is one of the most important problems in Hydraulic Engineering.

As you see, we have four independent variables including X1,X2,X3 and X4, and one dependent variable or Y. With Predict command and using NeuralNetwork method, how I can get a good fit between Y and independent variables?

Best wishes, Mohammad

Attachments:
POSTED BY: M.A. Ghorbani

Hi,

I am not convinced that this is a well posed problem. Anyway - here comes an absolutely unscientific approach (and the answer seems to be 64):

ClearAll["Global`*"]
data[y_] := {{12, 14, 19, 22}, {15, 18, 27, 33}, {30, 42, 53, y}}
Manipulate[
 ListPlot3D[data[y], MeshFunctions -> {#3 &}, 
  PerformanceGoal -> "Quality"], {y, 10, 100, 1}]

Does that make any sense to you?

POSTED BY: Henrik Schachner
Reply to this discussion
Community posts can be styled and formatted using the Markdown syntax.
Reply Preview
Attachments
Remove
or Discard

Group Abstract Group Abstract